
Best Gantt Chart PowerPoint Templates for Project Managers
If you manage projects, you already know this problem.
Your actual project plan lives in a tool — Asana, Jira, Monday, or a spreadsheet. It is detailed and accurate and works well for day-to-day tracking.
Then someone asks you to present the project timeline in a meeting.
Suddenly you are either screenshotting your project tool and trying to make it look presentable on a slide, or you are building a Gantt chart manually in PowerPoint using colored rectangles — which takes forever, never looks right, and has to be rebuilt from scratch every time the timeline changes.
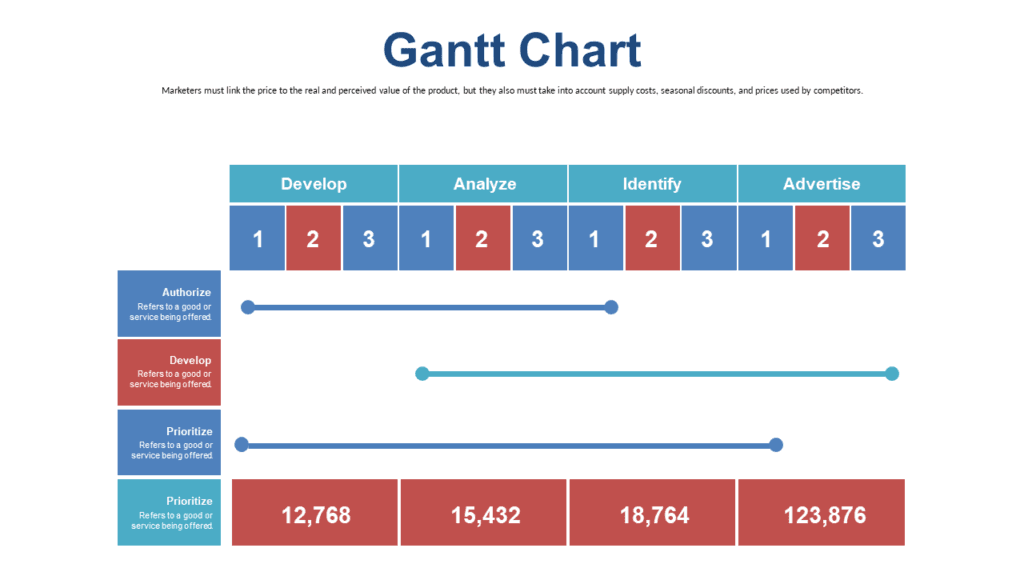
Every Gantt Chart template on SlideSwift is a complete focused deck built specifically for project timeline presentations. You are not getting one Gantt slide buried in a general business collection. You are getting a deck where every slide — the overall project overview, the phase breakdown, the milestone tracker, the status update — is designed around communicating project timelines clearly.
Update the bars and labels for your project, and your presentation is ready.
Why Screenshots of Your Project Tool Do Not Work in Presentations
The instinct to screenshot Asana or Jira is completely understandable. The data is already there. But it almost never works well as a presentation slide.
Project management tools are designed for people who are actively working in them — small text, dense information, interface colors that match the app. On a presentation screen or projector, that translates to a slide that is too small to read, designed for a software UI rather than an audience, and impossible to update without taking a new screenshot.
A Gantt chart PowerPoint template gives you the same information in a format that actually works in a meeting — clear task bars, readable labels, milestone markers, and a visual design that fits your deck rather than a web application.
Best Gantt Chart PowerPoint Decks on SlideSwift
Each template below is a complete 20-slide focused deck — every slide built around project timeline presentations. Fully editable in PowerPoint, Google Slides, and directly in your browser after purchase with no software needed. All decks are $5.99 and available in Light theme, 16:9 widescreen format.
Professional Project Schedule Gantt Chart PowerPoint Templates
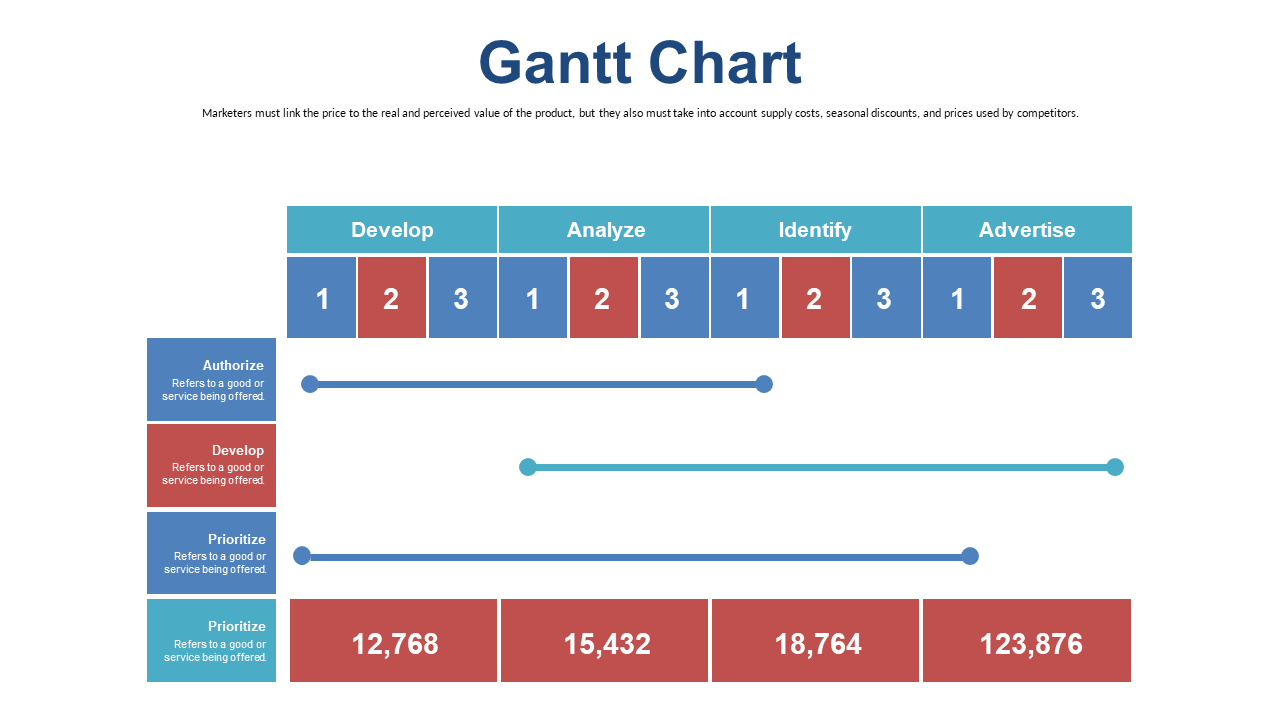
A clean, professional 20-slide Gantt chart deck built for project scheduling, sprint planning, and deadline management. Each slide covers a different timeline layout — weekly views, phase breakdowns, milestone trackers, and status update slides. Good for project managers who present timelines to leadership or clients regularly and need something that looks polished without spending time on design.
Price: $5.99 | Slides: 20 | Theme: Light | Format: 16:9 Widescreen
Project Schedule Gantt Chart PowerPoint Templates
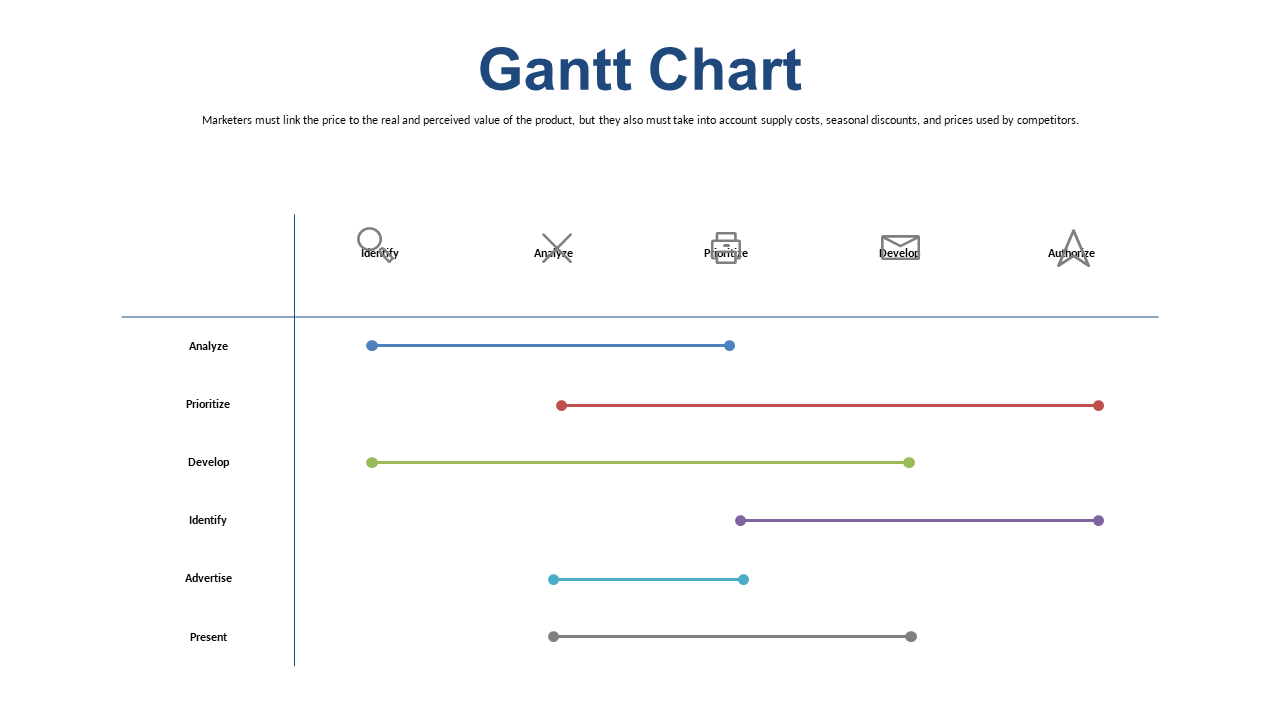
A versatile 20-slide Gantt chart deck designed for project scheduling across different industries and team sizes. Includes multiple Gantt layouts with editable task bars, phase labels, and milestone markers — so you can choose the slide that fits your specific timeline structure rather than forcing your project into a single format. Update the bars and labels in minutes.
Price: $5.99 | Slides: 20 | Theme: Light | Format: 16:9 Widescreen
Editable Project Schedule Gantt Chart PowerPoint Templates
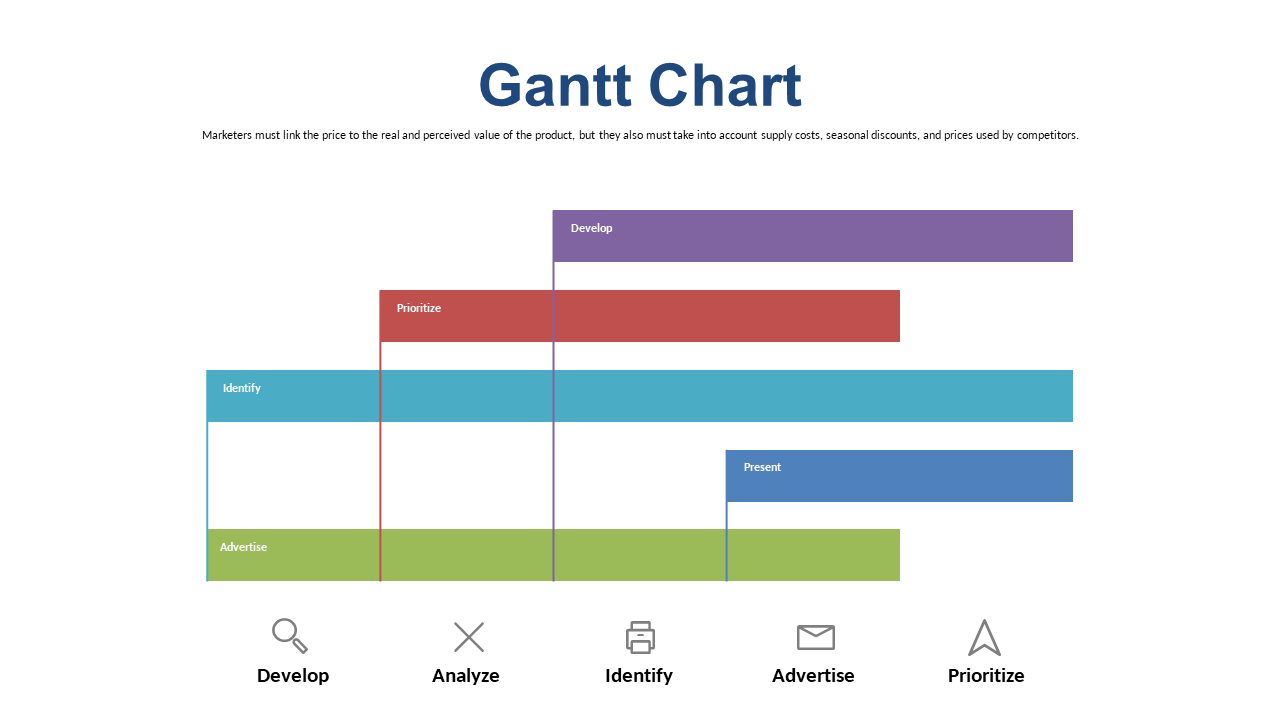
A straightforward 20-slide Gantt chart deck focused on editability — every task bar, date label, phase marker, and milestone is an independent editable shape. No locked groups, no flattened images. Built for project managers who need to update their timeline slide quickly before a meeting without fighting with the layout. Works equally well for sprint planning, construction schedules, and marketing campaign timelines.
Price: $5.99 | Slides: 20 | Theme: Light | Format: 16:9 Widescreen
Only Need One Gantt Slide? Pick Exactly What You Need.
If your presentation is mostly built and you just need one Gantt or timeline slide to drop into it — not a full 20-slide deck — the SlideSwift Gantt Chart Slide Library has individual Gantt slides available at $0.99 per slide.
No subscription. No minimum order. Pick the one slide you actually need, mix it with slides from other categories if you want, and you are done.
How to Edit a Gantt Chart Template in PowerPoint
People often assume Gantt charts are complicated to edit in PowerPoint. In practice, once you understand how the pieces work, updating a Gantt template for your project takes about ten minutes.
Changing task names: Click directly on any task label and type your own. It is a regular text box — nothing special about it.
Adjusting task duration: Each task bar is a colored shape. Click to select it, then drag the right edge to make it longer or shorter. Drag the whole bar left or right to shift the start date.
Adding a task: Copy an existing task bar (Ctrl+C, Ctrl+V), drag it to the right row, and resize it to match the duration you need.
Changing colors: Right-click any bar → Format Shape → Fill → pick your color. Useful for color-coding by team, priority, or status.
Adding milestones: Milestone markers are shapes on the template. Copy one and drag it to the right point on the timeline.
Every element on the slide is an independent editable shape. Nothing is locked or flattened. You have complete control over every piece.
Can I Edit These Without Installing PowerPoint?
Yes. After purchase, every SlideSwift template opens directly in a built-in online editor in your browser — no PowerPoint installation required. Edit text, change colors, adjust elements, and export the file without leaving the page where you bought it.
If you prefer PowerPoint or Google Slides, download the PPTX file and everything is fully editable there too. For Google Slides, upload to Google Drive and open with Google Slides — all the Gantt bars, labels, and layouts transfer cleanly.
What Should a Gantt Chart Presentation Slide Actually Show?
Your project management tool probably has hundreds of tasks in it. Your presentation slide should not.
What a stakeholder audience typically needs to see:
The major phases. Group your work into three to six main phases. Each phase gets one bar. The individual tasks inside each phase stay in your project tool — they do not need to be on the slide.
Key milestones. The two or three most important checkpoints — a launch date, a major delivery, a go/no-go decision. Mark these visually so they stand out from the regular task bars.
The overall timeframe. Start date, end date, how long everything takes. Your audience should be able to read this in thirty seconds without doing mental math.
Current status (for update presentations). Use color to show what is complete, in progress, and coming up. Makes the status immediately readable without requiring anyone to read every task bar.
Gantt Template vs Gantt Software — Which Do You Need?
Gantt software like Microsoft Project, TeamGantt, or the Gantt views in Asana and Monday is the right tool for actually running a project. Real-time updates, dependency tracking, team notifications — all of that belongs in the software.
A Gantt PowerPoint template is the right tool for presenting a project timeline. You are communicating the plan to an audience — not managing it from the slide.
Most project managers use both. The software for day-to-day management, the template when it is time to take that information into a meeting and present it clearly.
Browse All Gantt Chart Templates — Complete 20-Slide Decks at $5.99
Next time you need to present a project timeline, you do not have to rebuild the slide from scratch or try to make a screenshot look presentable.
Start with a deck that is already built for it, update the bars and labels for your project, and spend the rest of your preparation time on the actual content — the decisions, the risks, the status your stakeholders need to hear.