Present Sequential Steps with Waterfall Chart
Product Description
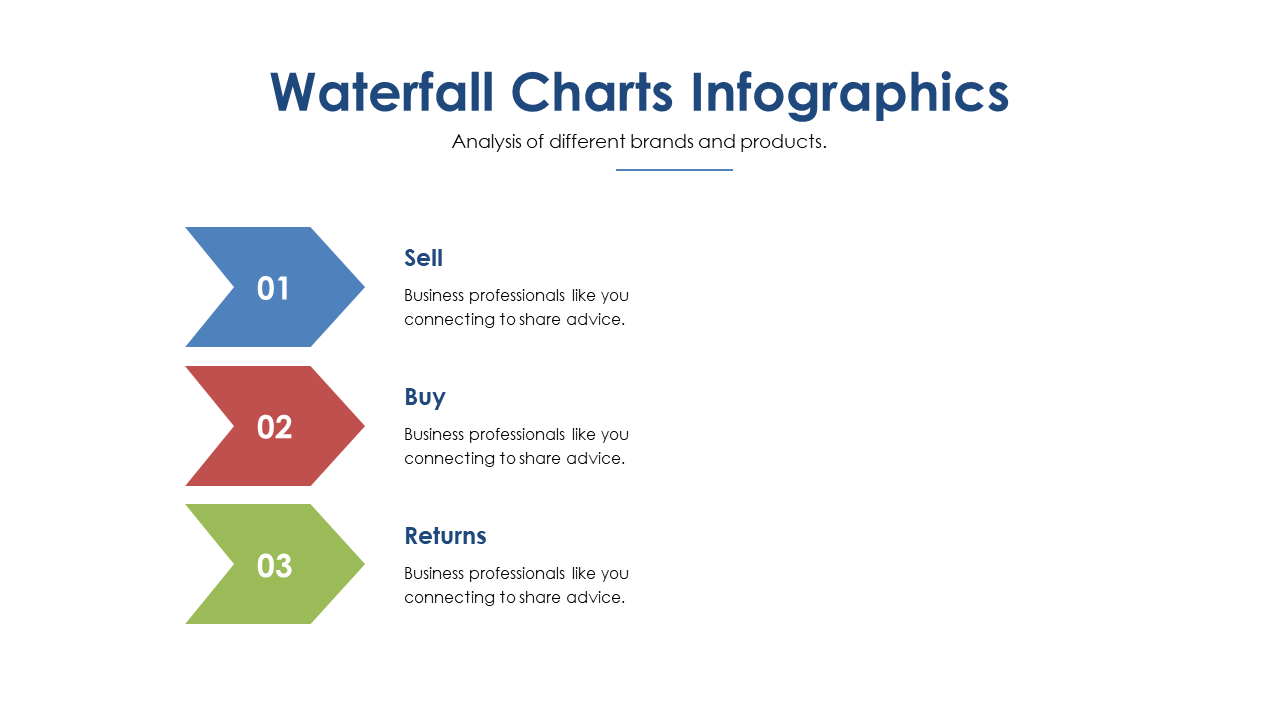
You know that explaining complex processes can leave your audience feeling lost, especially when you’re trying to simplify intricate workflows. The waterfall chart on this slide breaks down sequential steps like Sell, Buy, and Returns, making your message clear and easy to understand.
This slide is ideal for operations managers presenting product lifecycle processes, project coordinators discussing phase transitions in project management, or sales directors explaining their customer journey. Whether you’re in retail, manufacturing, or any service-based industry, this chart can help clarify your points in team meetings or strategic planning sessions.
For just $0.99, you can download this slide and have it ready for use in minutes. It’s fully editable in PowerPoint and Google Slides, so
you can customize it to fit your specific needs without any hassle.
$0.99 – Purchase Checkout
Added to cart







