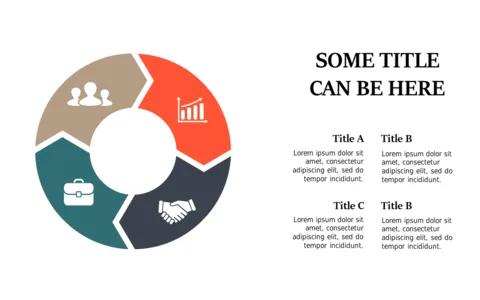
Showcase Milestones with Water Droplet Indicators V4

Product Description
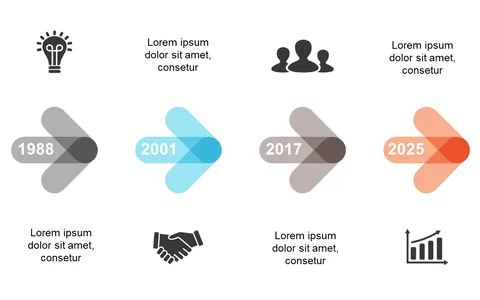
Aligning your team on project milestones can be tricky, especially when updates tend to be dry or uninspiring. This engaging slide transforms your milestones into vibrant visuals with its captivating water droplet indicators, allowing you to showcase progress in a way that keeps interest high.
This slide is perfect for team leaders in creative industries during collaborative project reviews or product managers sharing progress with cross-functional teams. The dynamic design not only conveys information but also energizes discussions around milestones and achievements.
At just $0.99, you can easily download this slide and make it your own in PowerPoint or Google Slides. Editing is simple, and you’ll have it ready for your next meeting in just minutes.
$0.99 – Purchase Checkout
Added to cart