Present Overlapping Data with Venn Diagram
Product Description
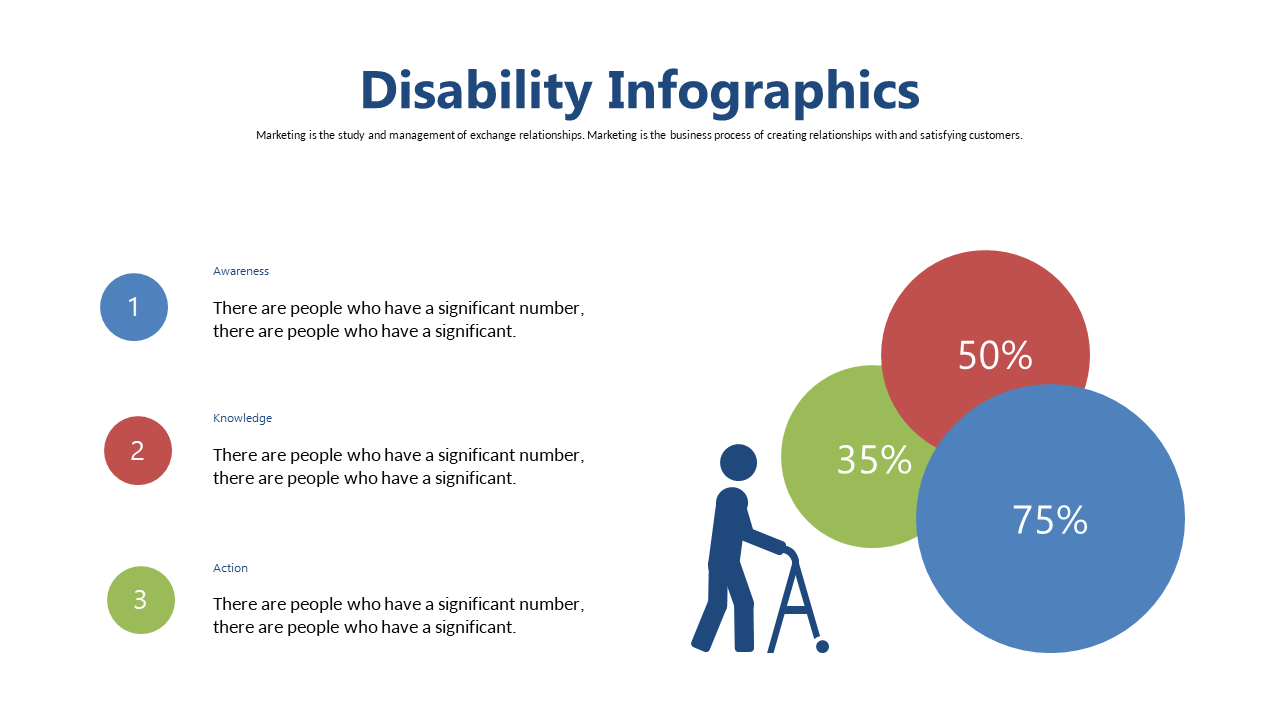
Complex data can overwhelm even the most experienced presenters, especially when you need to show where categories overlap. This Venn diagram slide simplifies that process, allowing you to visually represent relationships among different datasets for maximum clarity.
Whether you’re a data analyst presenting quarterly reports, a marketing manager discussing target demographics, or a project lead outlining various project elements, this slide fits right into your toolkit. It’s great for team meetings or strategic planning sessions, where clear communication is essential.
For just $0.99, this slide is available for instant download and can be easily edited in PowerPoint or Google Slides. You’ll have it ready in no time, making your presentation both professional and effective.
$0.99 – Purchase Checkout
Added to cart







