Showcase Project Management with Venn Diagram
Product Description
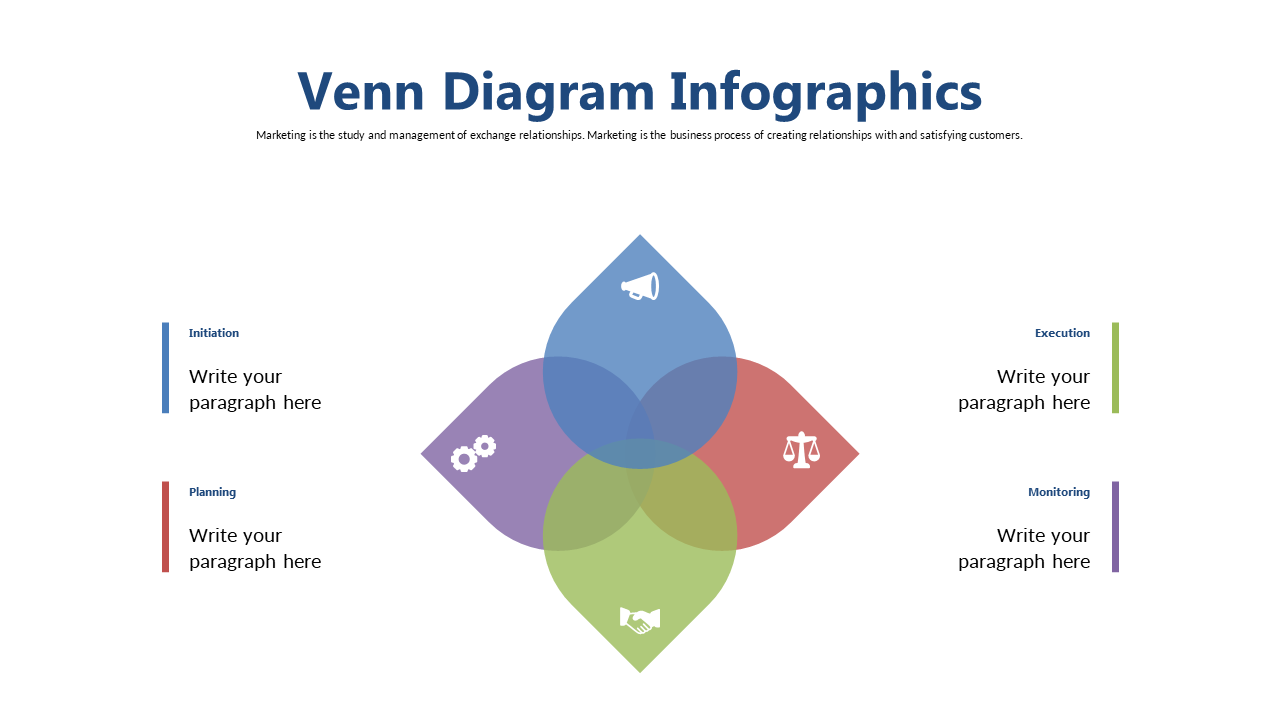
Managing multiple projects simultaneously can create confusion, especially when trying to convey how various elements interact. This Venn diagram slide is a fantastic way to visually present those relationships, simplifying complex information into an understandable format. Your audience will find it easy to grasp the interplay of different project components at a glance.
This slide is ideal for project managers coordinating cross-functional teams, consultants conducting project reviews, or anyone involved in presenting project status updates. Imagine using it during stakeholder meetings or project kickoff sessions to ensure everyone is on the same page regarding project dynamics. The clarity it provides will help you drive your message home effectively.
At only $0.99, this slide can be downloaded instantly and customized for your unique needs. It’s fully editable in both PowerPoint and Google Slides, so you can tweak it to fit your presentation style effortlessly. Get ready to impress your audience with a clear visual representation that’s just a click away.
$0.99 – Purchase Checkout
Added to cart







