Communicate Processes with Venn Diagram Design
Product Description
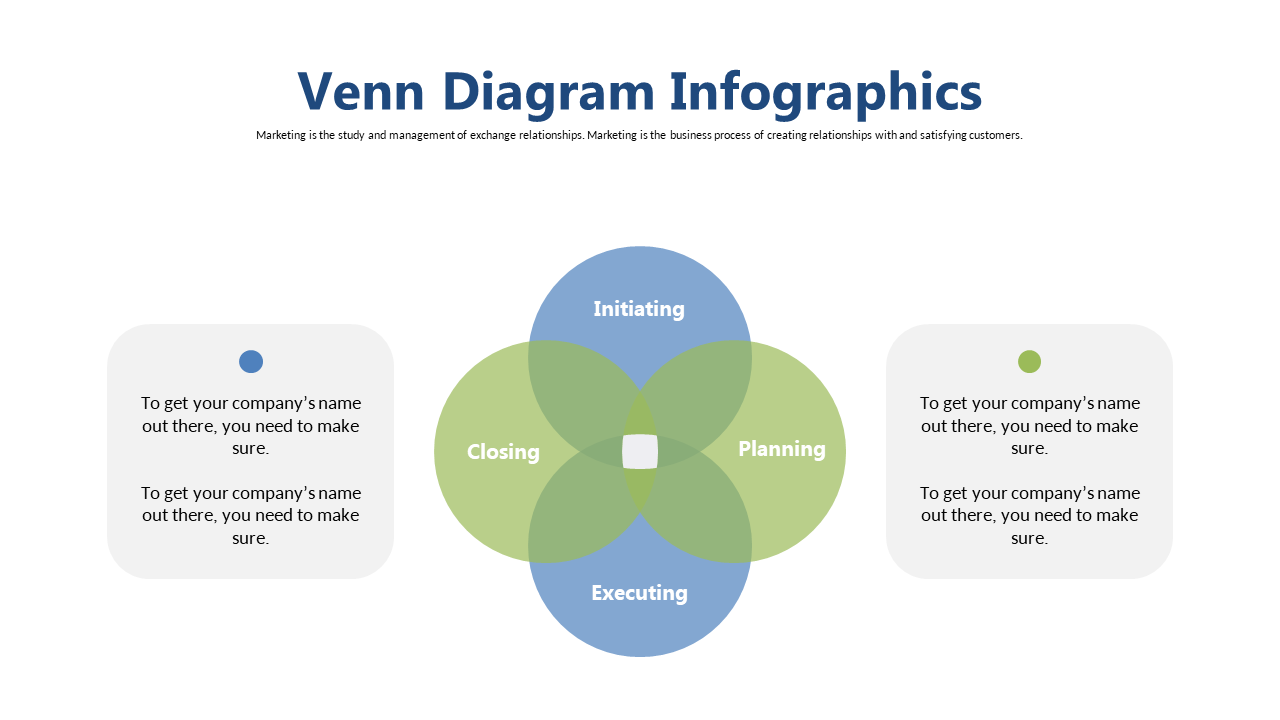
When it comes to communicating complex processes, it’s vital to make relationships clear. A well-designed Venn diagram is an effective way to visualize interconnected ideas, helping your audience to engage with the material on a deeper level. This slide allows you to present information in a way that’s both informative and easy to digest.
You’ll find this slide useful across a range of roles, such as business consultants mapping out workflows, educators delivering lessons, or team leaders reviewing project milestones. Using it in meetings, training sessions, or presentations can significantly enhance understanding, saving time and preventing misunderstandings.
Your audience will thank you for the clarity. Priced at just $0.99, this slide is available for instant download and can be edited easily in both PowerPoint and Google Slides. Tailor it to your specific needs in minutes and elevate your presentations with this engaging visual tool.
$0.99 – Purchase Checkout
Added to cart







