Visualize Branding Relationships with Venn Diagram
Product Description
Communicating brand relationships clearly is essential, yet it can be difficult to do effectively. Without a solid visual aid, your audience may struggle to grasp how different branding elements interact.
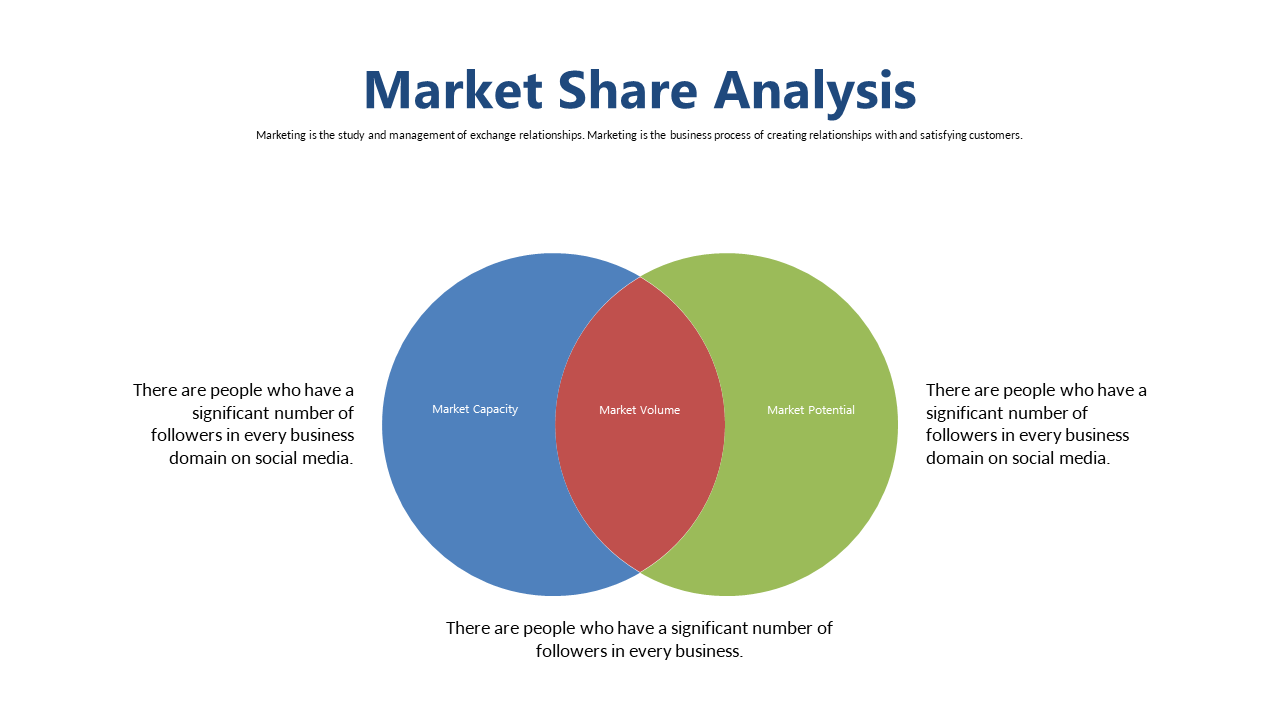
This Venn diagram elegantly visualizes the connections between quality, customer service, and price, making it straightforward for your audience to understand. Content strategists, marketing managers, and brand consultants will find this slide particularly beneficial during client presentations, branding workshops, and team brainstorming sessions. When you want to convey intricate brand dynamics, this diagram simplifies the message beautifully.
Available for $0.99, this slide is ready for immediate download and can be tailored effortlessly in PowerPoint or Google Slides. You’ll be set to impress in just minutes.
$0.99 – Purchase Checkout
Added to cart







