Present Data Trends with Up and Down Arrows
Product Description
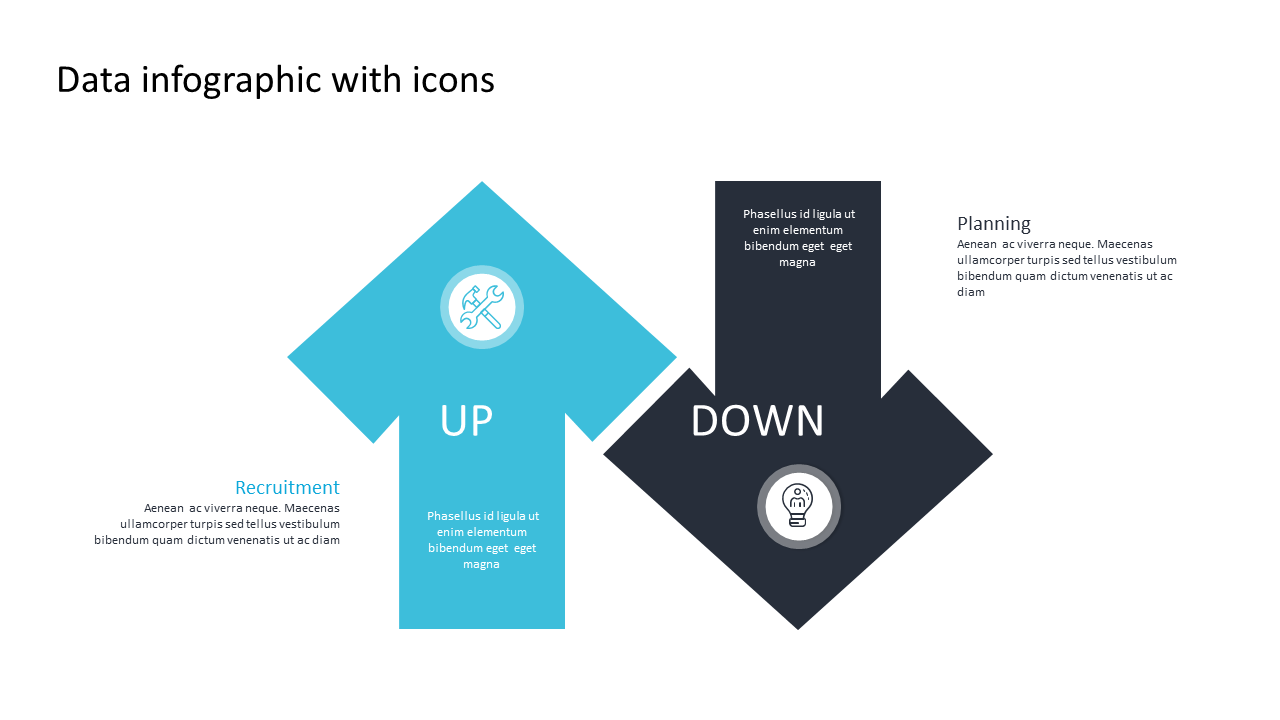
Finding ways to present data trends clearly can feel overwhelming amidst a flood of information. You want to engage your audience while ensuring they grasp the essential insights at a glance. This slide’s vibrant up and down arrows paired with circular icons provide a visually striking way to represent data trends.
Marketing analysts and sales managers can benefit from this slide when presenting quarterly performance reviews or trend analyses. It’s perfect for team meetings where quick, impactful insights are crucial, such as discussing market fluctuations or campaign outcomes. With this slide, you can transform dry numbers into compelling visuals that spark discussion and understanding.
At just $0.99, this slide is an instant download and is ready to edit in PowerPoint and Google Slides.
You can easily customize it to fit your needs and have it ready for your next presentation in minutes.
$0.99 – Purchase Checkout
Added to cart







