Show Project Milestones with Triangular Progress Indicator
Product Description
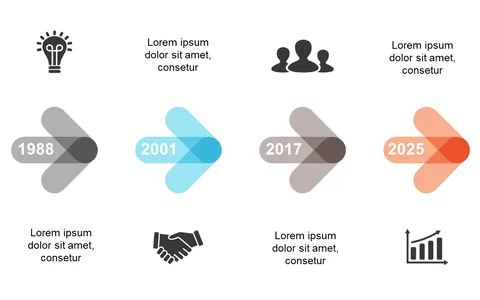
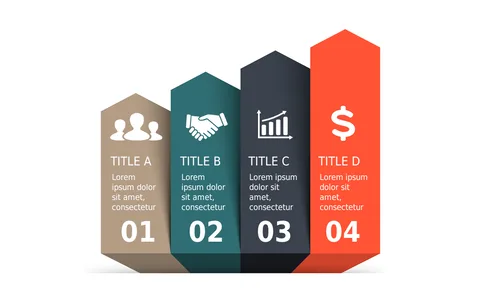
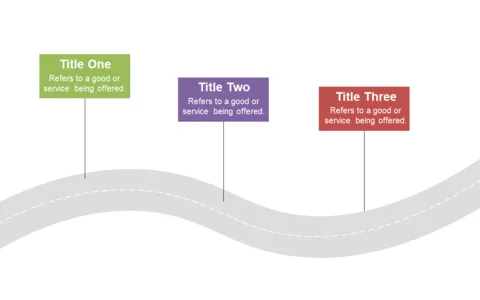
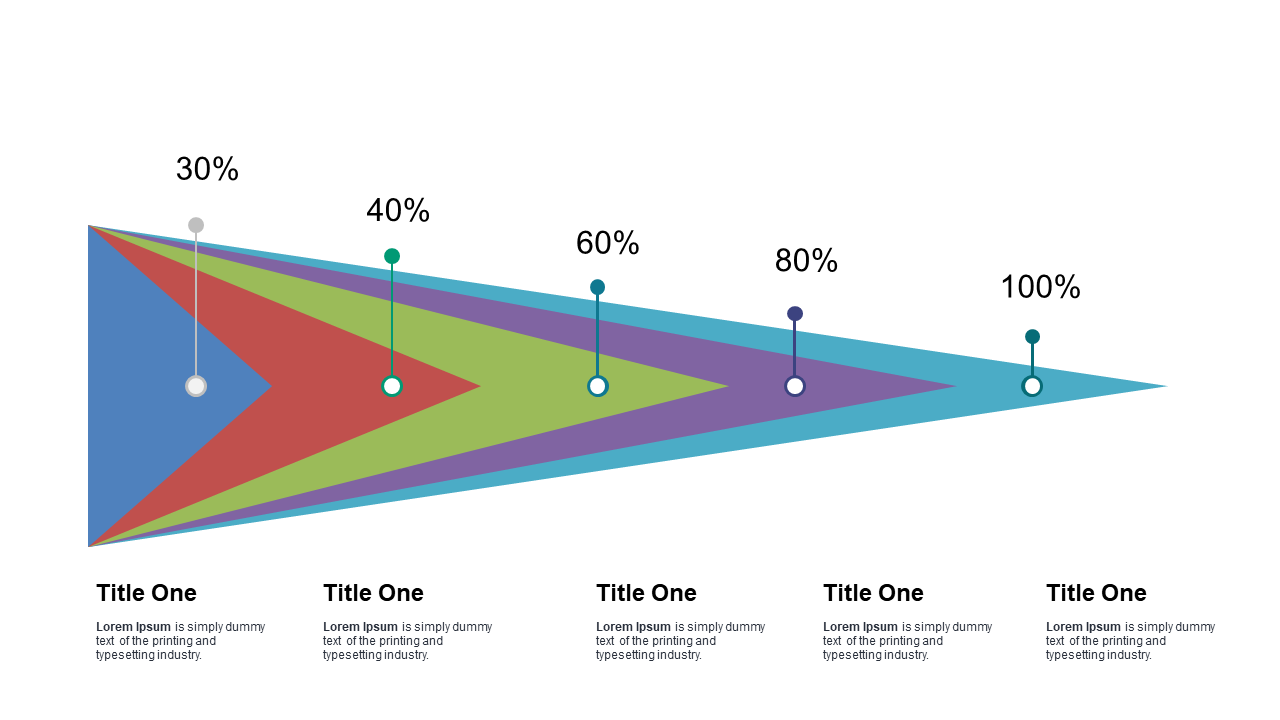
Project managers often struggle to communicate milestones clearly, which can lead to uncertainty within teams. This triangular progress indicator visually breaks down milestones into distinct segments, making it easier for everyone to understand where the project stands at any given moment.
You’ll find this slide especially useful during project kickoffs, status updates, or team retrospectives, whether you’re in IT, construction, or product development. It helps create a clear visual roadmap for your team, ensuring everyone is aligned on what’s been accomplished and what’s next.
For just $0.99, this slide is available for instant download, so you can start using it right away. It’s easy to modify in PowerPoint and Google Slides, allowing you to personalize it with your project’s specifics in no time.
$0.99 – Purchase Checkout
Added to cart