Tree Infographic for Pricing Strategy Insights
Product Description
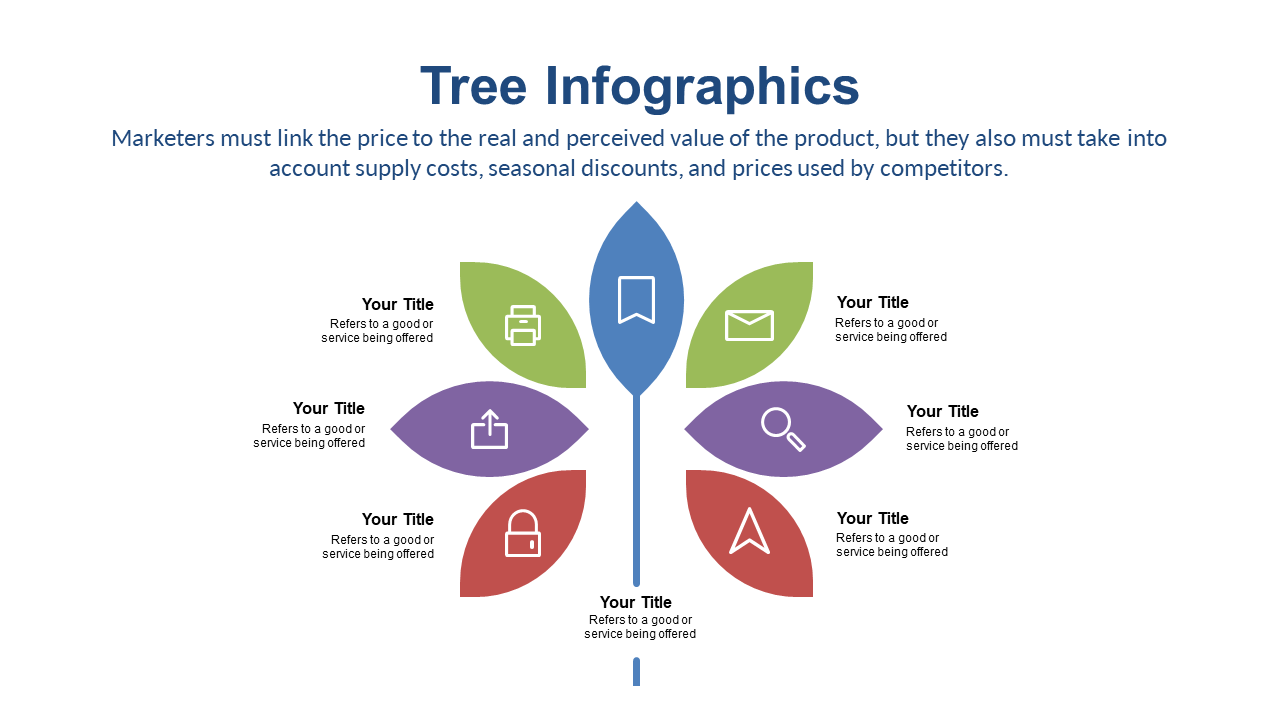
Presenting pricing strategies can often lead to confusion if not visualized properly. This tree infographic simplifies complex pricing elements into clear, digestible components, making it easy for your audience to follow along. With its innovative design, this slide helps you convey essential insights without overwhelming anyone.
It’s perfect for pricing analysts, marketing strategists, and product managers during meetings where pricing discussions take center stage. Whether you’re reviewing your pricing model with the sales team or preparing for a board meeting, this slide provides clarity and structure to your presentations.
At only $0.99, this slide is available for instant download and can be easily edited in both PowerPoint and Google Slides.
You can customize it in just minutes, making it an invaluable resource for your pricing discussions.
$0.99 – Purchase Checkout
Added to cart







