Tree Infographic for Pricing Strategies
Product Description
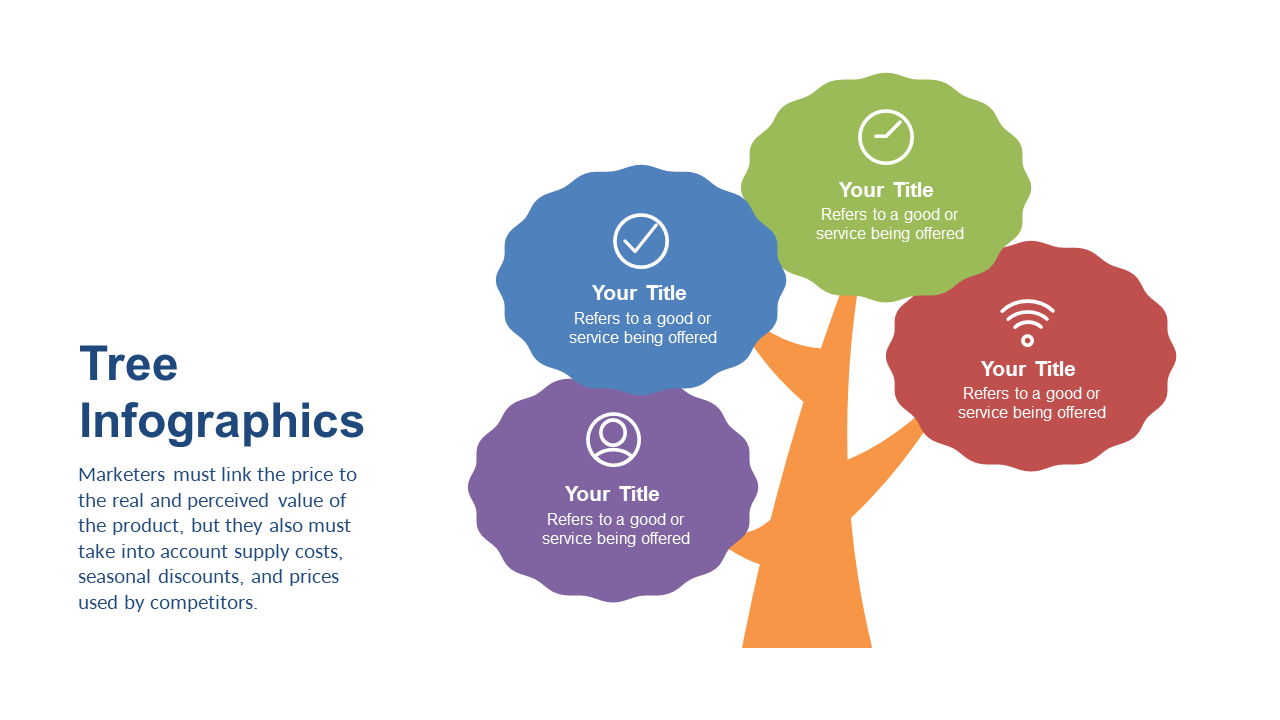
Presenting complex pricing strategies can be a daunting task, and clarity is often the key to effective communication. This tree infographic simplifies that challenge, allowing you to visually display various attributes related to your offerings, making it easier for your audience to understand your pricing model.
This slide is perfect for product managers or business analysts preparing for client presentations or internal strategy meetings where pricing needs to be discussed. It’s also great for sales teams that want to explain pricing tiers or options to customers clearly.
For only $0.99, you can download this eye-catching infographic, which is fully editable in both PowerPoint and Google Slides. Make your pricing strategy presentations more engaging in just minutes.
$0.99 – Purchase Checkout
Added to cart







