Proportional Circles Tree Infographic for Marketers
Product Description
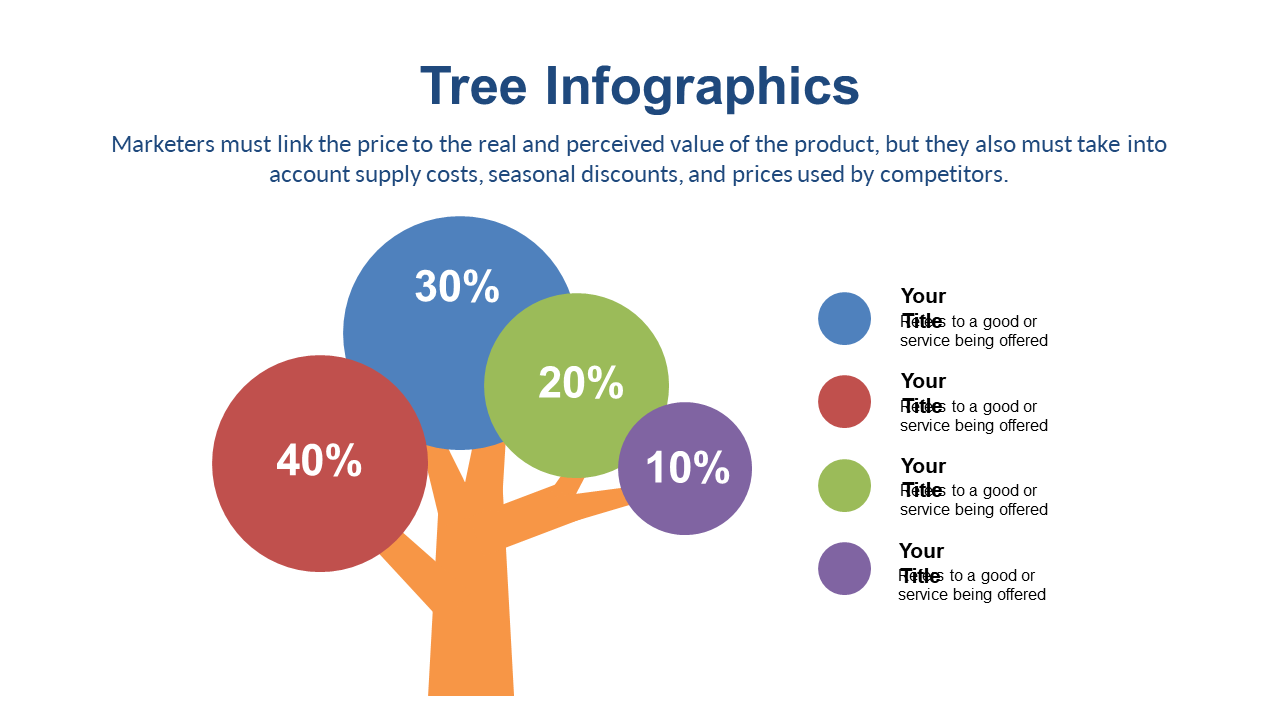
When you need to present complex data that demands attention, it can be tough to find the right visuals. This infographic slide tackles the challenge head-on with a striking tree design featuring proportional circles to highlight your key points. It transforms dense information into a format that’s visually engaging and easy to understand.
Ideal for marketers, data analysts, and business development managers, this slide serves you well in team meetings, presentations to clients, or even marketing strategy sessions. Whether you’re discussing campaign performance metrics or market segmentation, this infographic helps clarify your message and keep your audience engaged.
For just $0.99, you’ll receive an instant download that’s ready to edit in PowerPoint and Google Slides.
You can customize it to fit your needs in minutes, making it a perfect tool for your next presentation.
$0.99 – Purchase Checkout
Added to cart







