Visualize Pricing Strategies with a Tree Infographic
Product Description
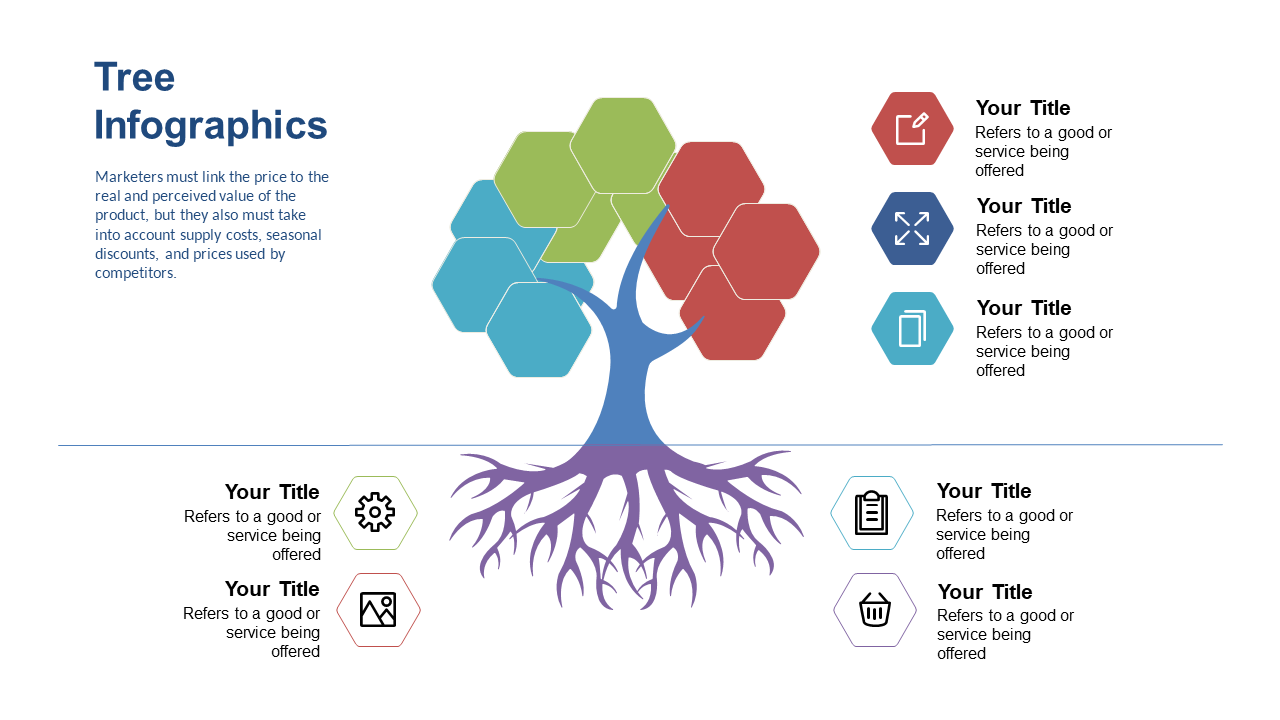
Clarifying pricing strategies can be a daunting task, often leaving your audience puzzled rather than informed. This tree infographic slide simplifies complex pricing structures into a visually engaging format, allowing you to present your offerings in a way that’s easy to follow and understand.
Ideal for finance professionals during budget reviews or sales managers explaining tiered pricing to clients, this slide can also assist marketing strategists when outlining pricing plans in presentations. It ensures everyone is on the same page regarding your pricing model.
Download this slide for just $0.99 and customize it instantly in PowerPoint or Google Slides. You’ll have a striking visual ready to enhance your discussions in minutes.
$0.99 – Purchase Checkout
Added to cart







