Engaging Three Countries Infographic for Data Insights
Product Description
Presenting data from multiple countries can quickly become overwhelming, especially when trying to draw meaningful insights. Without an effective visual aid, key messages can be lost, making it difficult for your audience to understand the trends at play.
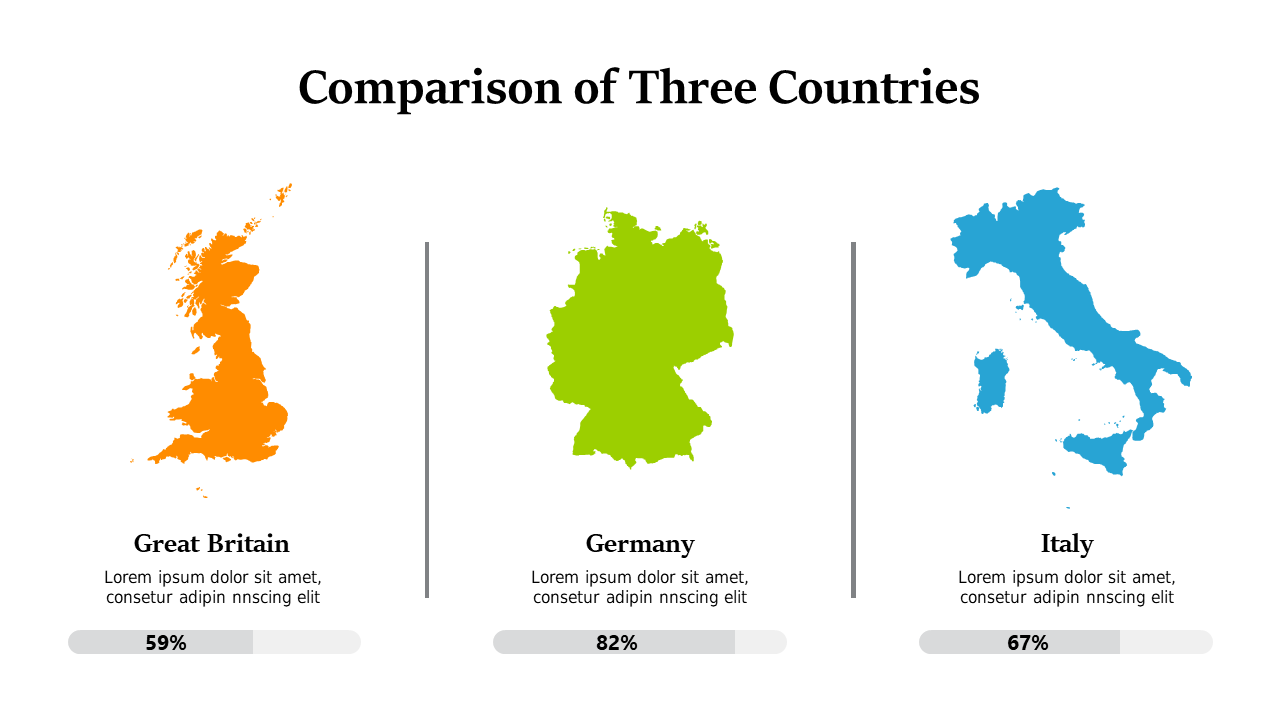
This engaging infographic simplifies the representation of data by featuring three countries, each clearly labeled with actionable percentage information. This slide is perfect for business analysts diving into global market studies, economists evaluating international economic performance, or educators teaching about global demographics. The visual clarity helps you convey your message and keeps your audience engaged throughout the discussion.
For just $0.99, you can download this infographic slide and edit it easily in PowerPoint or Google Slides. It’s a quick way to enhance your presentation, and you’ll have it ready to go in no time.
$0.99 – Purchase Checkout
Added to cart







