Three Countries Infographic for Visual Data Presentation
Product Description
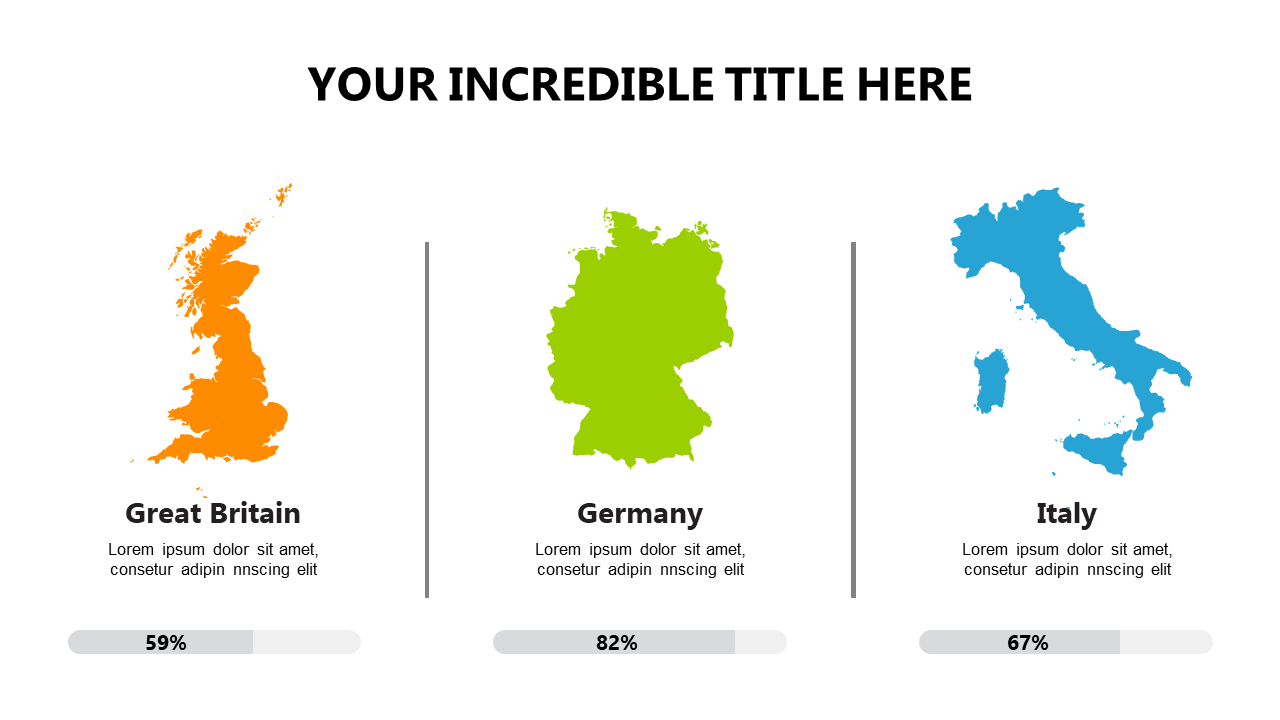
Presenting data that spans multiple countries can be challenging, especially when you want to convey insights clearly and effectively. This infographic slide provides a powerful visual narrative with outlines of three countries filled with percentage data, helping you showcase comparisons in a compelling way.
Market researchers analyzing international trends or project managers assessing performance across regions will find this slide essential. It’s ideal for presentations, reports, or discussions where visual data representation is needed to drive home your points.
At just $0.99, this slide is available for instant download and is easy to edit in both PowerPoint and Google Slides. You can quickly customize it to fit your needs and enhance your presentation.
$0.99 – Purchase Checkout
Added to cart







