Showcase Information with Three-Column Cloud Infographics V2
Product Description
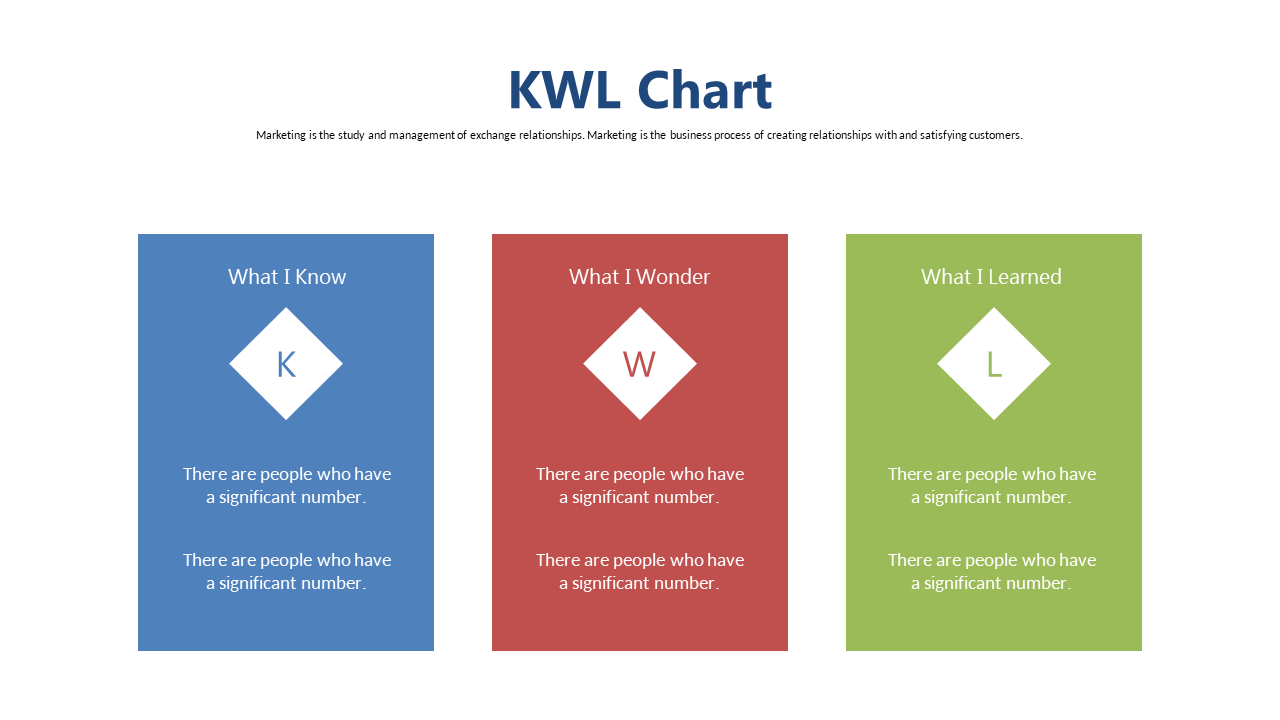
Presenting complex information can often lead to confusion for your audience. This three-column cloud infographic organizes your data in a way that brings clarity and focus, allowing viewers to quickly understand relationships and processes.
You can ditch verbose explanations and let your visuals do the talking. This slide is perfect for financial analysts showcasing quarterly results, educators mapping out curriculum standards, or healthcare professionals summarizing patient data trends. Whether you’re in a boardroom presentation or a classroom lecture, this layout will help you convey intricate details without overwhelming your audience.
For just $0.99, you can instantly download this slide and make it your own. It’s fully editable in PowerPoint and Google Slides, so you can tailor it to fit your specific needs in just minutes.
$0.99 – Purchase Checkout
Added to cart







