Visualize Medical Data with Thermometer Infographic
Product Description
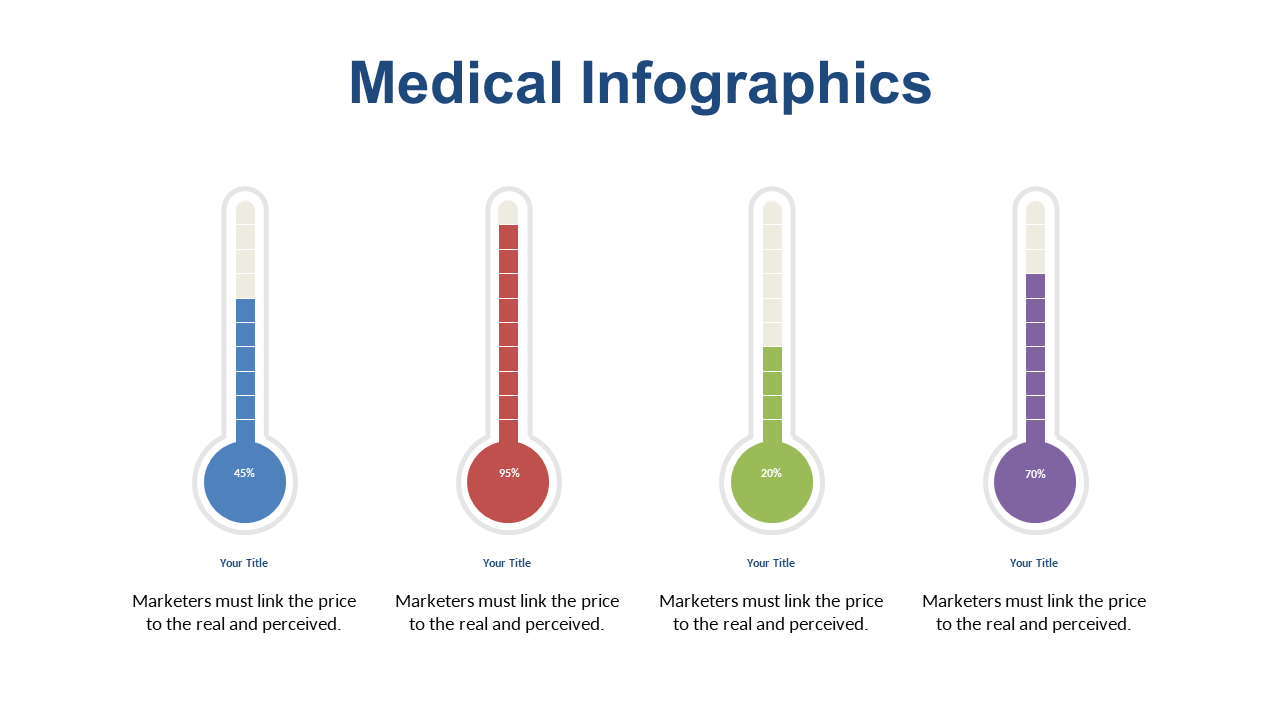
When faced with the task of presenting medical data, the challenge lies in making numbers relatable and easy to interpret. Complicated statistics can alienate an audience, but this thermometer infographic slide turns daunting figures into an engaging visual story that captures attention and drives understanding.
Medical professionals, such as epidemiologists or health data analysts, will find this slide invaluable during presentations that require the sharing of important trends or health metrics. It is also suitable for medical sales representatives looking to showcase effective results from their products in a clear and compelling way.
At only $0.99, this slide is a quick and cost-effective solution for your presentation needs. Once downloaded, you can edit it effortlessly using PowerPoint or Google Slides, ensuring you’re prepared to impress your audience in minutes.
$0.99 – Purchase Checkout
Added to cart







