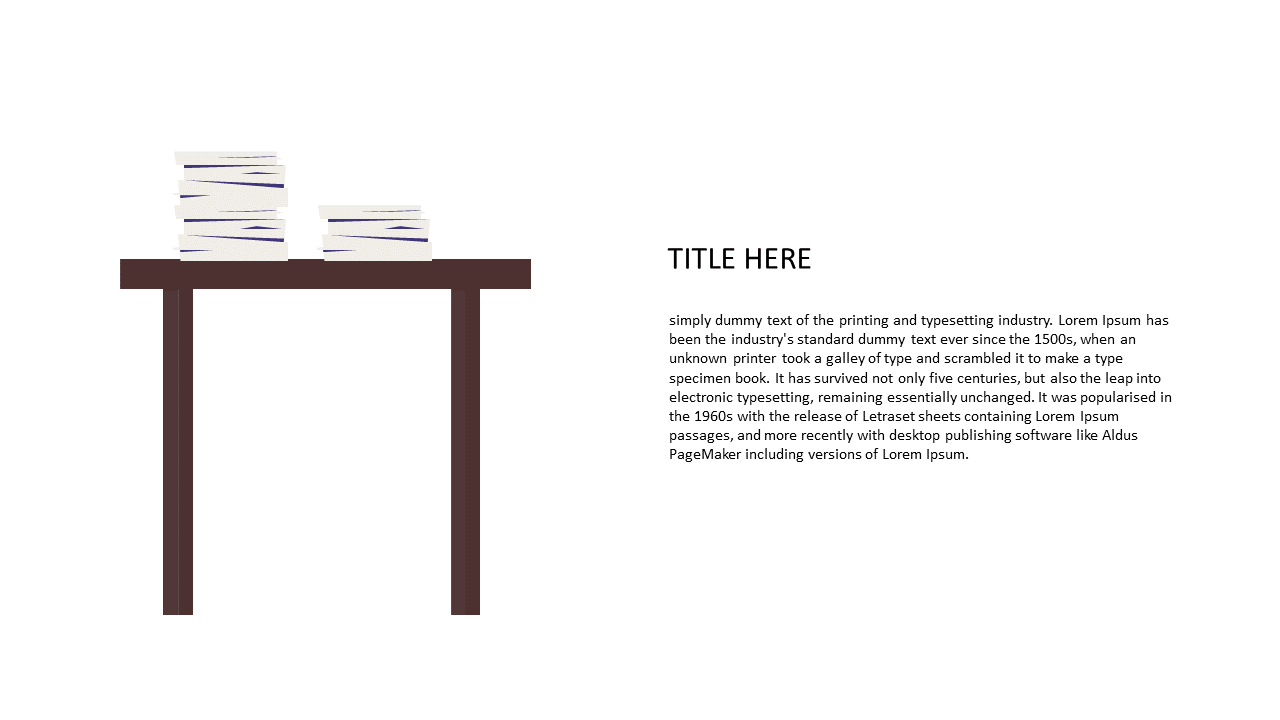
Present Data Clearly with Stacked Papers Table
Product Description
Data can quickly become overwhelming, leaving your audience confused if your visuals aren’t clear. The Stacked Papers Table slide helps you present intricate data in a straightforward, organized way, ensuring your audience understands the information you share. It’s a smart solution to improve comprehension during any presentation.
Analysts, project managers, and business development teams will find this slide particularly useful.
Whether you are presenting market research in a sales meeting, showcasing performance metrics in quarterly reviews, or explaining survey results in a workshop, this table will keep your data organized and accessible.
Available for just $0.99, this slide is ready for instant download and can be edited easily in PowerPoint or Google Slides. Get started on enhancing your presentations and make that data shine in just minutes.
$0.99 – Purchase Checkout
Added to cart







