Highlight SWOT Elements with Circular Highlights

Product Description
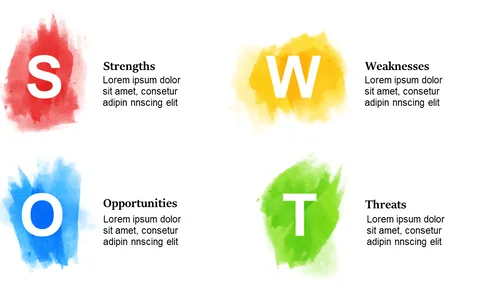
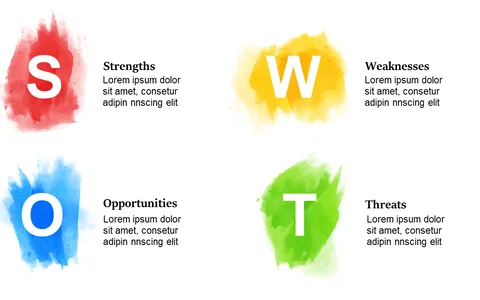
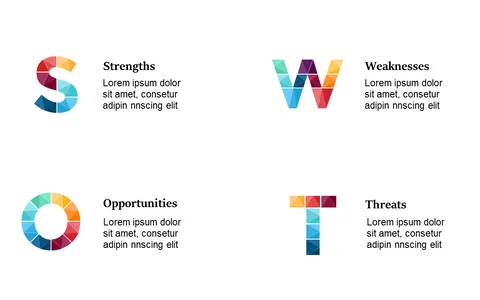
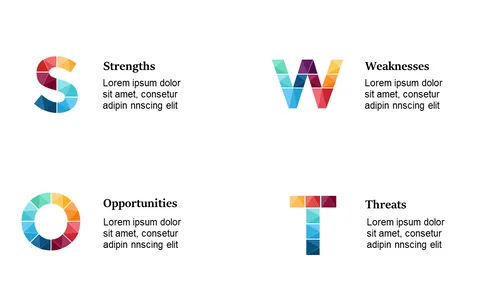
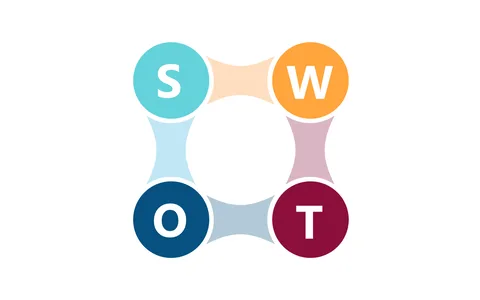
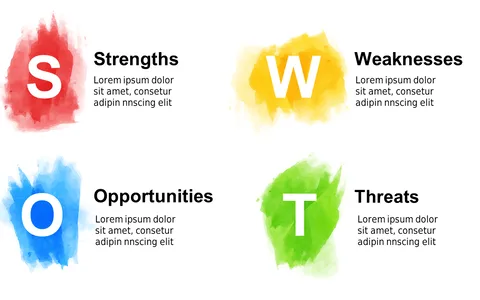
Communicating the elements of a SWOT analysis can often lead to confusion, especially if the visuals don’t engage your audience. This slide uses circular highlights to represent each SWOT element clearly, making it both visually appealing and easy to understand.
You can present complex insights in a straightforward manner without losing your audience’s interest. Marketing managers, analysts, and team leaders will find this slide ideal for discussions about product development, market evaluations, or strategic planning sessions. It’s particularly useful when you want to spark conversations around your findings while keeping the presentation engaging.
You can get this slide for just $0.99, and it’s ready for instant download. Edit it as needed in PowerPoint or Google Slides, making it simple to adapt your content and deliver an engaging presentation right away.
$0.99 – Purchase Checkout
Added to cart