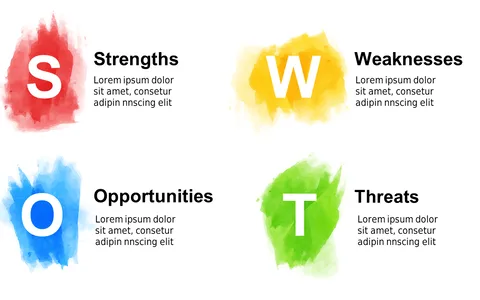
Conduct SWOT Analysis with Quadrant Diagram
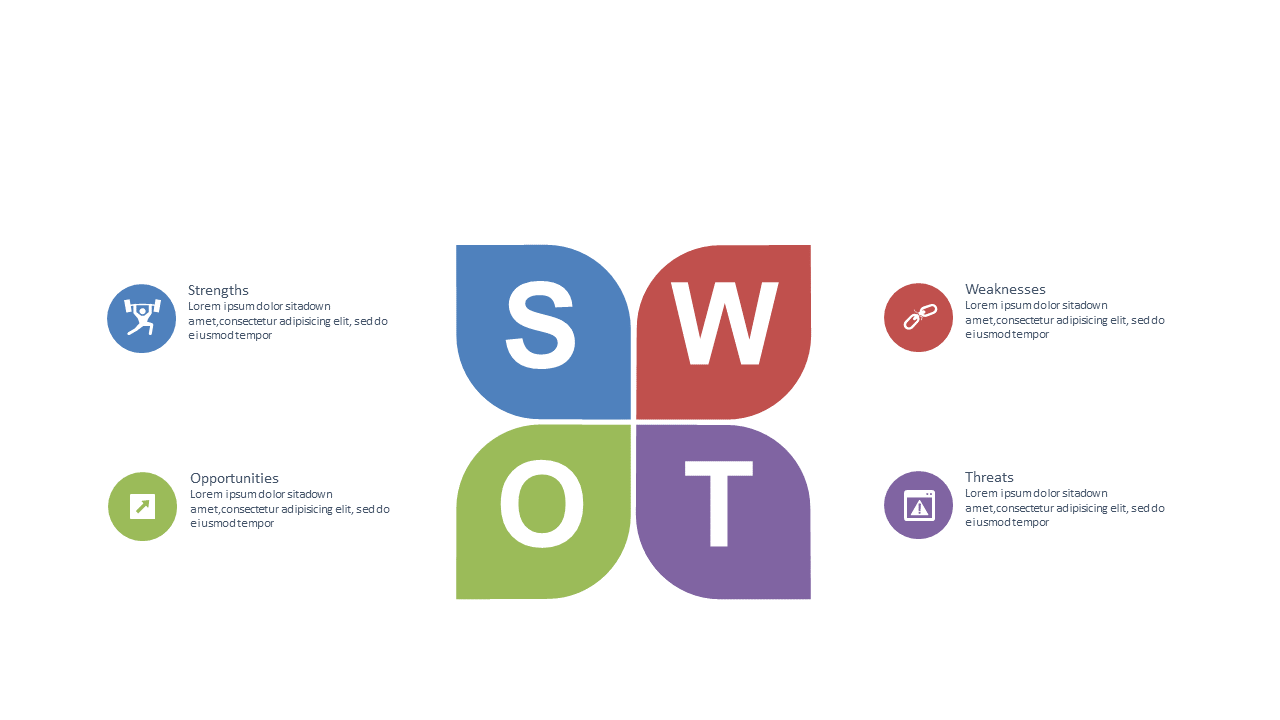
Product Description
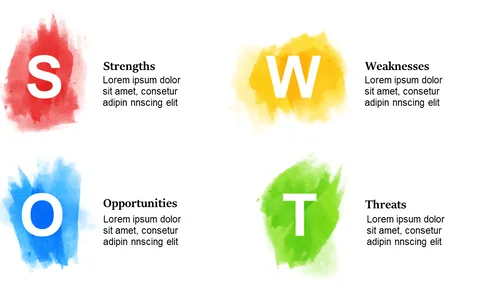
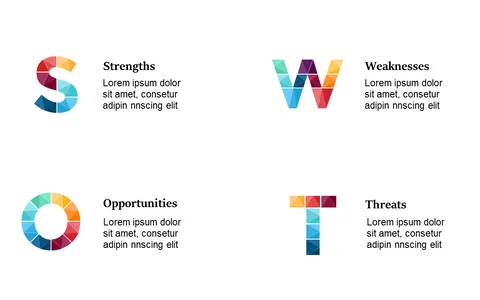
Sometimes, getting your point across during a SWOT analysis can feel overwhelming, especially when there’s so much data to cover. This quadrant diagram simplifies that process by organizing Strengths, Weaknesses, Opportunities, and Threats in a clear format that’s easy for your audience to follow.
This slide is valuable for business analysts, strategy consultants, and project teams conducting strategic planning sessions or risk assessments. It’s designed to help you present comprehensive insights while ensuring your audience remains engaged and informed.
At just $0.99, you can download this slide instantly, and it’s fully editable in PowerPoint and Google Slides. Prepare to make your next analysis presentation crystal clear and impactful.
$0.99 – Purchase Checkout
Added to cart