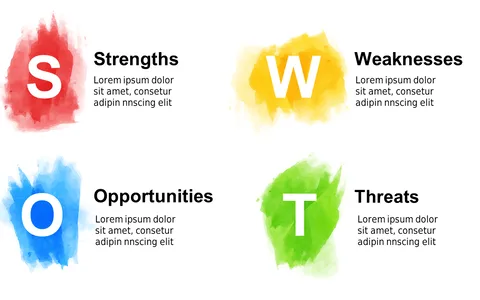
SWOT Analysis Circular Diagram for Strategy

Product Description
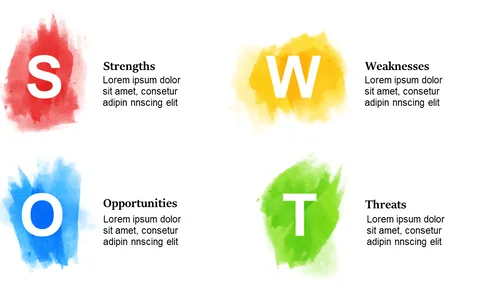
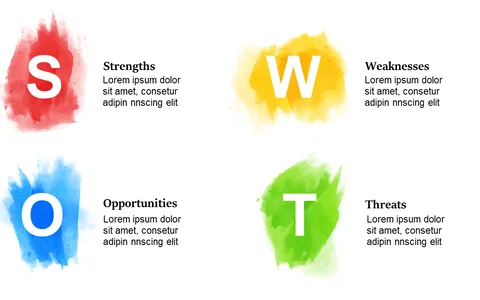
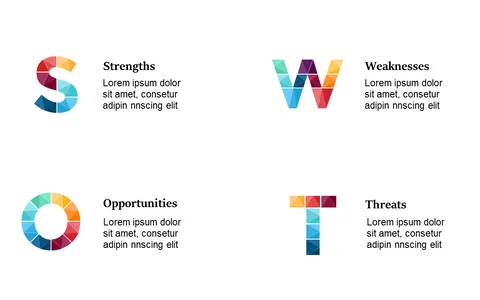
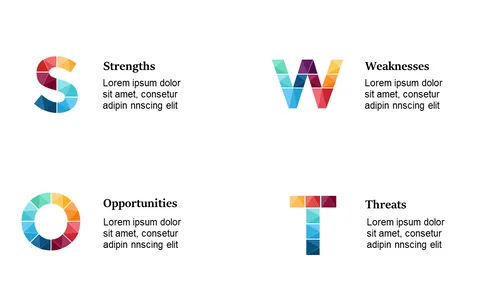
Clarity is essential when discussing your business strategy, and structuring a SWOT analysis can help illuminate key insights. This circular diagram segments Strengths, Weaknesses, Opportunities, and Threats visually, allowing you to present critical information at a glance.
Consultants and business analysts will find this slide useful when discussing strategic options with clients or during internal strategy sessions. It’s also perfect for executive teams looking to assess business performance in quarterly reviews.
At only $0.99, you can download this slide instantly and modify it in PowerPoint or Google Slides to fit your brand’s style. Showcase your strategic thinking effortlessly with this clean design.
$0.99 – Purchase Checkout
Added to cart