Startup Milestones Diagram for Effective Presentations
Product Description
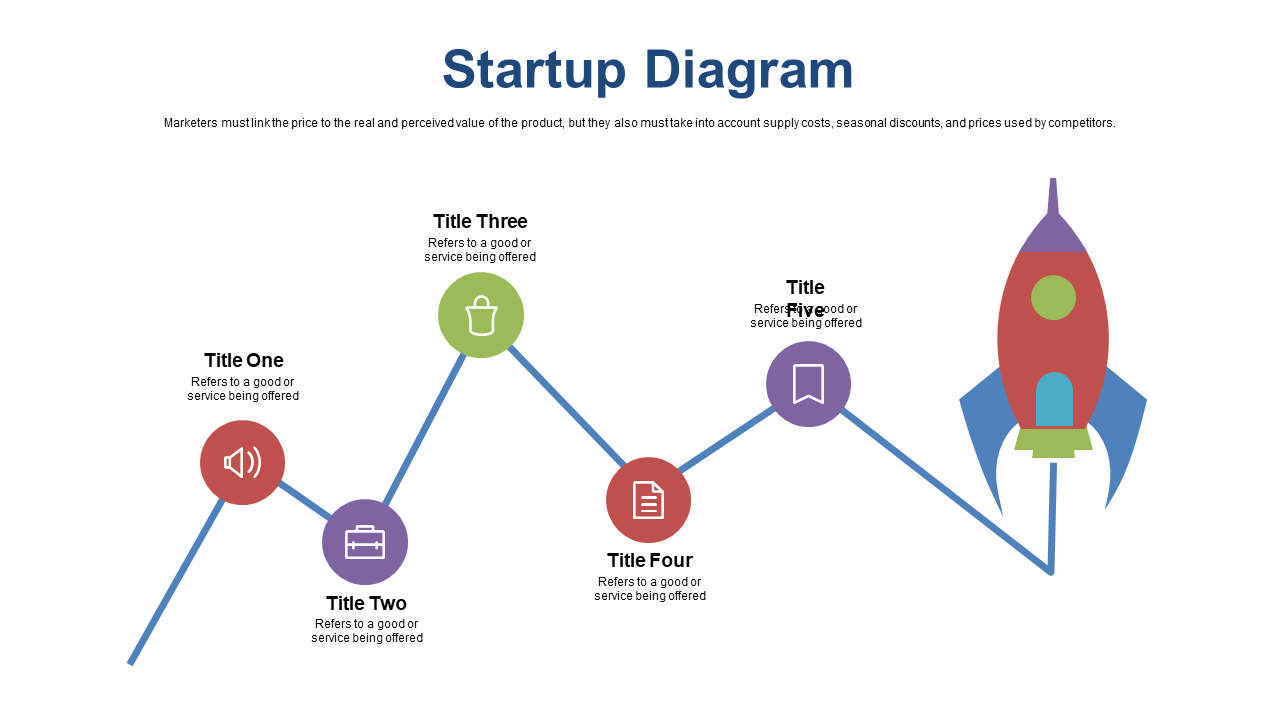
Presenting your startup’s trajectory can often lead to confusion, especially when trying to distill complex information into an understandable format. This startup milestones diagram allows you to visually represent key phases of your journey, making it easier for investors and partners to grasp your potential.
This slide is perfect for startup founders, venture capitalists reviewing business plans, or marketing consultants guiding clients through stages of growth. Whether you’re showcasing progress during a conference call or discussing strategies in a workshop, this diagram provides clarity and engagement.
Download this slide for only $0.99, and it’s ready for immediate use. Easily edit the text labels in either PowerPoint or Google Slides to tailor it to your unique story, ensuring you’re prepared for your next presentation in minutes.
$0.99 – Purchase Checkout
Added to cart