Visualize Competitive Analysis for Startups

Product Description
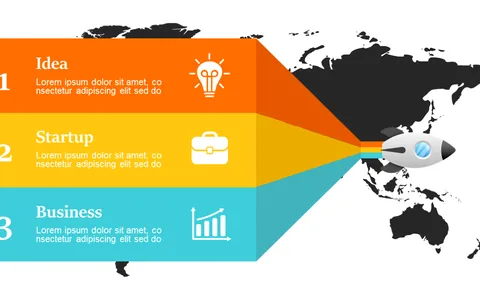
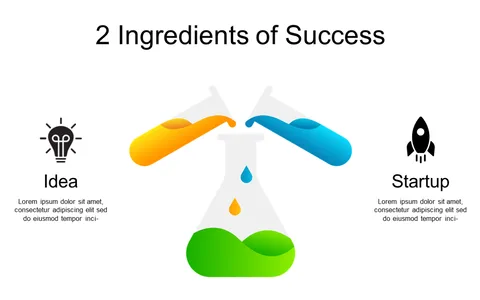
Understanding the competitive landscape is crucial for startup success, yet effectively illustrating it often proves challenging. This slide provides a visually captivating rocket graphic surrounded by circles to display your product features and how they compare against your competitors.
Startup founders and growth strategists will find this slide invaluable during pitch presentations or strategy sessions where they need to illuminate their product’s competitive edge. It’s also helpful for market analysts conducting competitor assessments for reports.
For just $0.99, you can gain instant access to this slide and edit it with ease in PowerPoint or Google Slides. Transform your presentations with this engaging visual aid that helps clarify your position in the market.
$0.99 – Purchase Checkout
Added to cart