Segment Key Information with Geometric Shapes

Product Description
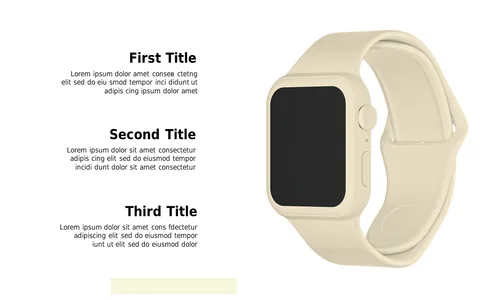
Presenting detailed information can overwhelm your audience, making it hard for them to grasp the essential points. Using geometric shapes to segment your content helps clarify complex information and guides your audience’s understanding.
This slide is ideal for educators, business analysts, and corporate trainers who need to convey intricate ideas during workshops, seminars, or classroom settings. Its clean design ensures that each piece of information stands out, making your presentation more effective.
For just $0.99, you can download this slide right away and customize it in both PowerPoint and Google Slides. It’s user-friendly, so you’ll be able to make the necessary edits and have a stunning presentation prepared in just minutes.
$0.99 – Purchase Checkout
Added to cart