Showcase Ideas with Segmented Circular Diagrams
Product Description
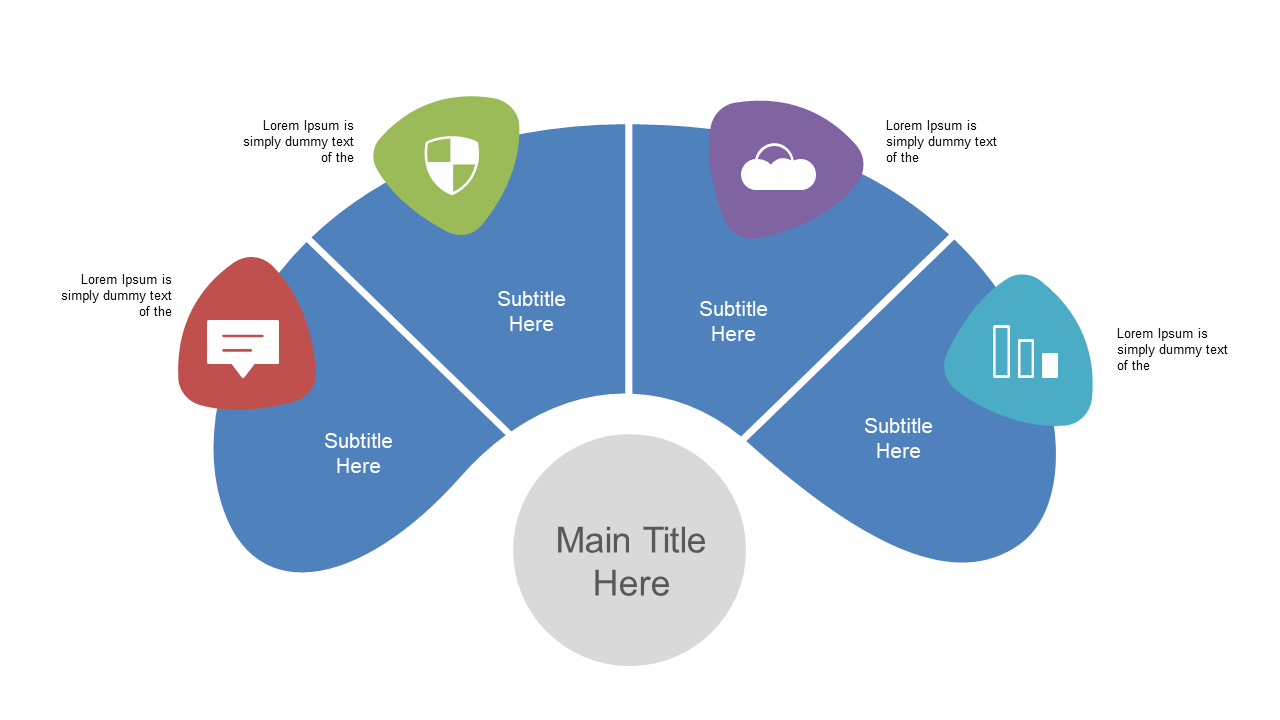
Conveying complex ideas can be daunting, especially when your audience struggles to follow your thought process. This segmented circular diagram offers a vibrant and clear way to visually represent your concepts, making them more accessible.
It’s perfect for product designers outlining features during sprint reviews or business analysts presenting market segmentation strategies. Use it in team brainstorming sessions or client meetings to help everyone visualize your points effectively.
For only $0.99, you can download this slide right away and customize it easily in both PowerPoint and Google Slides. Bring your presentations to life with visuals that resonate with your audience in just a few minutes.
$0.99 – Purchase Checkout
Added to cart







