Visual Roadmap with Milestones for Progression

Product Description
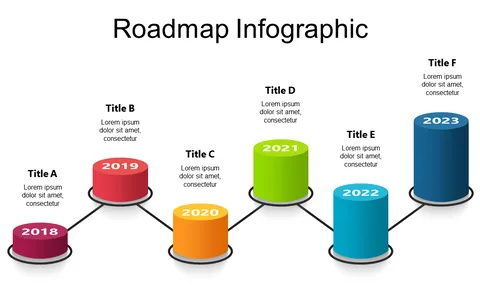
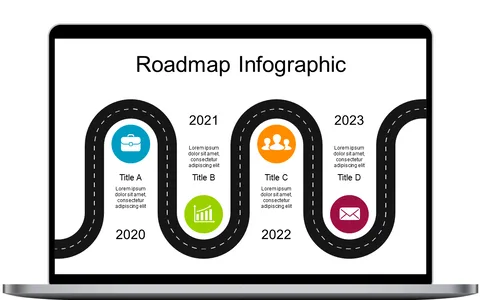
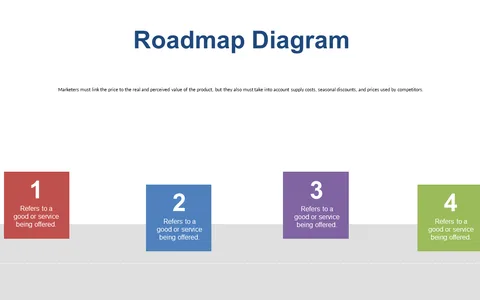
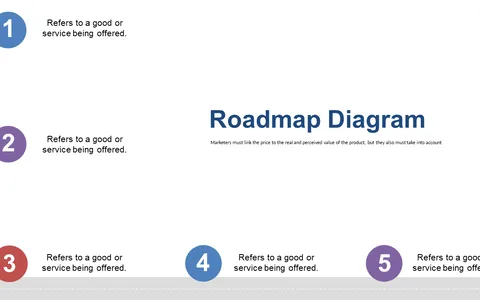
When trying to maintain focus on project progression, visualizing milestones can greatly enhance understanding among team members. Yet, many find it hard to create a simple and engaging way to illustrate their development phases. This slide offers a clean, effective layout with milestone markers that clearly communicate timelines and objectives, making it easy for everyone to follow along.
Project coordinators, product managers, and team leads across various industries can use this slide in progress meetings or status reports. It’s designed to keep your team aligned and aware of their goals, ensuring everyone knows what needs to happen next.
Perfect for those looking to foster accountability and clear communication during a project. For only $0.99, this slide can be instantly downloaded and edited in PowerPoint or Google Slides. Tailor it to your project’s milestones and have it ready to present in just a few minutes.
$0.99 – Purchase Checkout
Added to cart