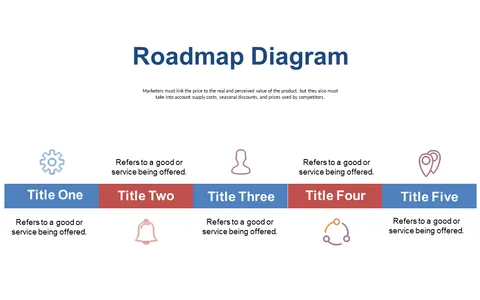
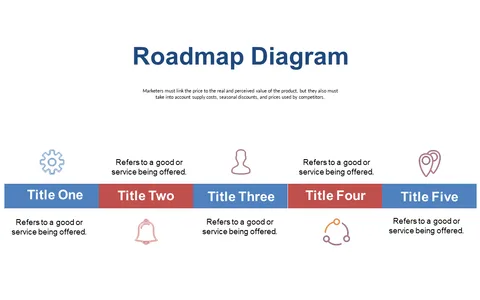
Showcase Key Stages with Roadmap Infographic
Product Description
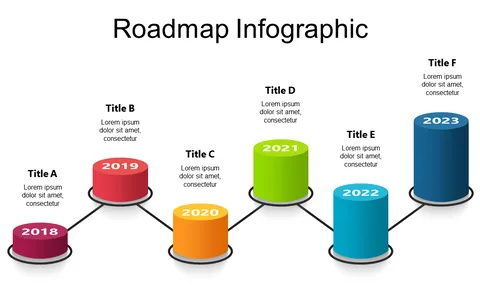
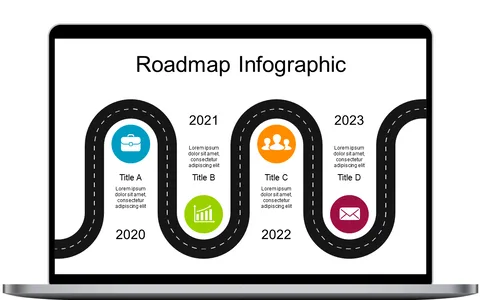
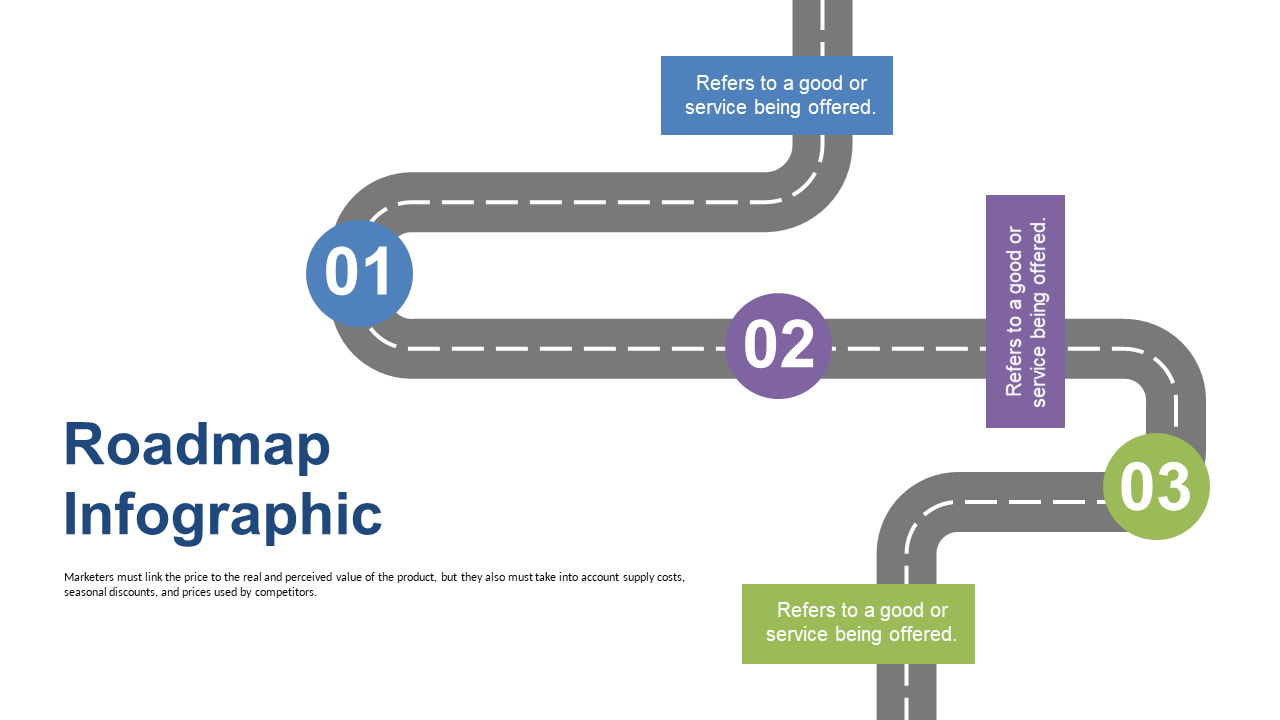
Communicating the progress of your project can feel like trying to solve a puzzle with missing pieces. Without a clear visual representation, team members may struggle to understand key milestones and how they fit into the overall timeline. This roadmap infographic serves as a vital tool to help everyone see the big picture in a straightforward manner.
Project managers in tech or marketing often face this challenge during status updates or planning meetings. Use this slide to outline your deliverables for a quarterly review, or during a project kickoff, ensuring that everyone is aligned on what’s ahead.
It’s ideal for anyone needing to break down complex timelines into digestible parts. For just $0.99, you can download this slide instantly and edit it in PowerPoint or Google Slides. It’s ready to use in minutes, allowing you to focus on delivering your message instead of wrestling with visuals.
$0.99 – Purchase Checkout
Added to cart