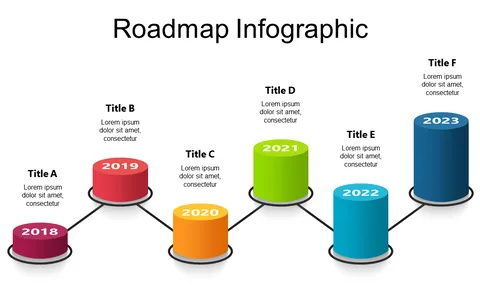
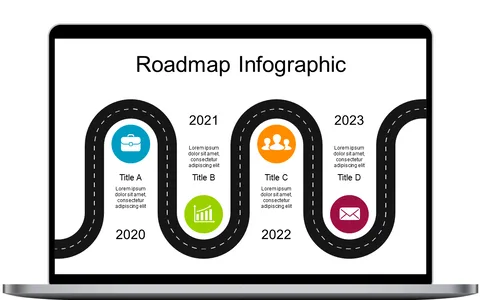
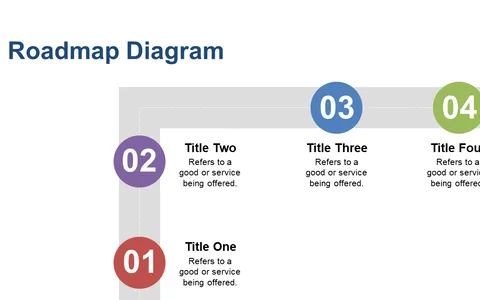
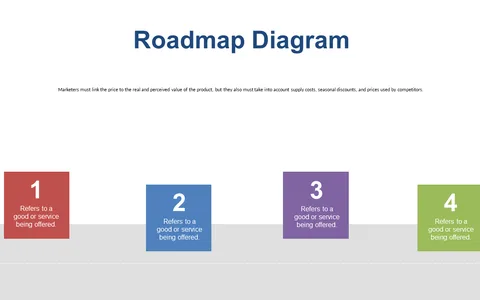
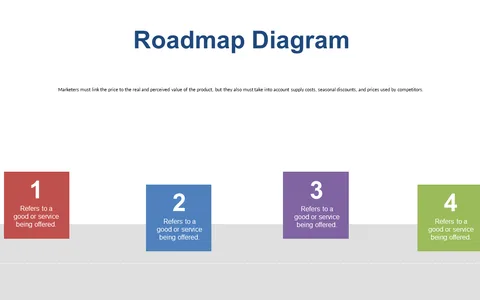
Highlight Stages with Engaging Roadmap Infographic

Product Description
Managing a project often involves juggling multiple stages, and conveying these phases clearly can be tricky. This engaging roadmap infographic simplifies that process, providing a straightforward way to present key milestones that your audience needs to understand.
This slide is particularly useful for project coordinators in industries like construction or IT, who need to present updates during team meetings. Its clear layout helps ensure that everyone involved knows exactly where the project stands and what’s coming next.
For just $0.99, you can download this slide and have it ready for your next presentation. It’s easily editable in both PowerPoint and Google Slides, so
you can customize it to fit your project’s unique needs in minutes.
$0.99 – Purchase Checkout
Added to cart