Recycling Infographic for Sustainability Initiatives
Product Description
Presenting complex information about recycling and sustainability doesn’t have to be overwhelming. You need a clear and engaging way to share these important concepts with your audience.
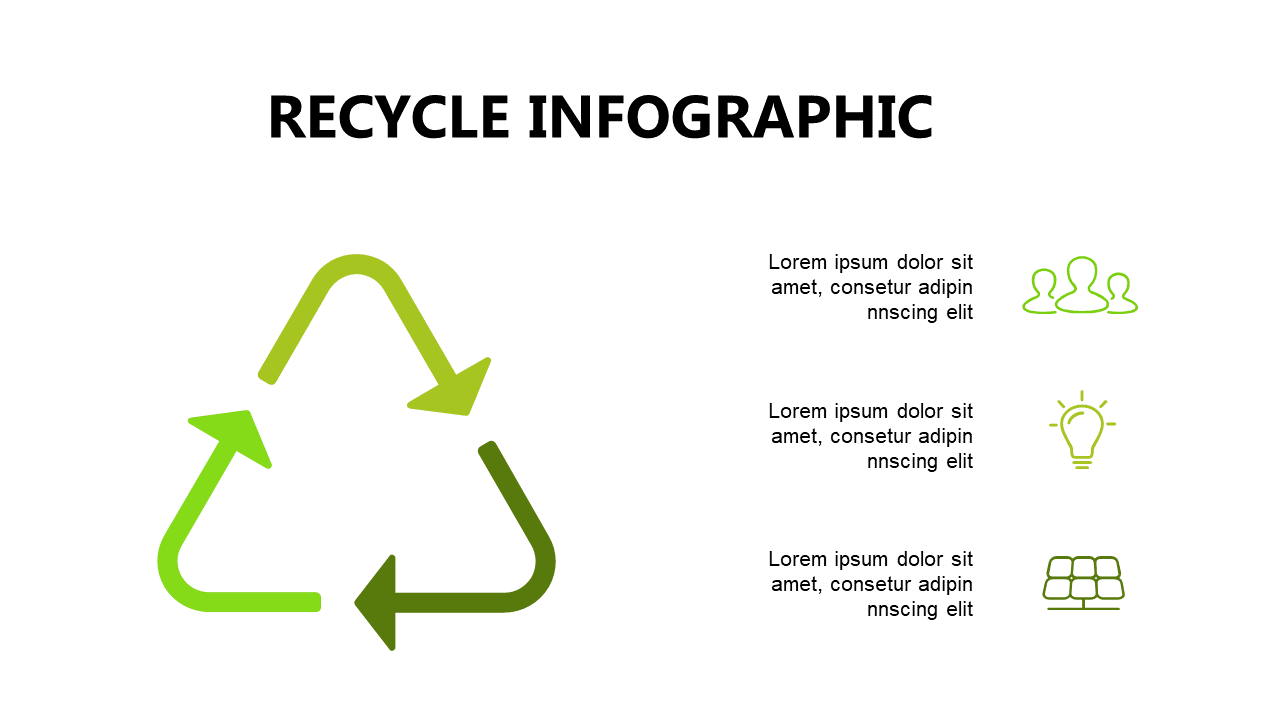
This infographic slide uses a central recycling symbol and directional arrows to illustrate your points effectively, making it easier for viewers to grasp the essentials. This slide is well-suited for environmental advocates presenting at community workshops, educators discussing sustainability in classrooms, or corporate sustainability officers sharing progress with stakeholders. It can also serve non-profits looking to educate the public about recycling initiatives with compelling visuals that motivate action.
For only $0.99, this slide is ready for instant download and easy customization. You can edit it seamlessly in PowerPoint or Google Slides, allowing you to tailor the content to best fit your presentation goals.
$0.99 – Purchase Checkout
Added to cart







