Visualize Customer Queries with Editable Infographic
Product Description
Customer feedback can often resemble a jumbled mess of data points, making it hard to extract actionable insights. A well-structured visualization is crucial for content strategists who need to turn customer queries into clear narratives that drive decisions.
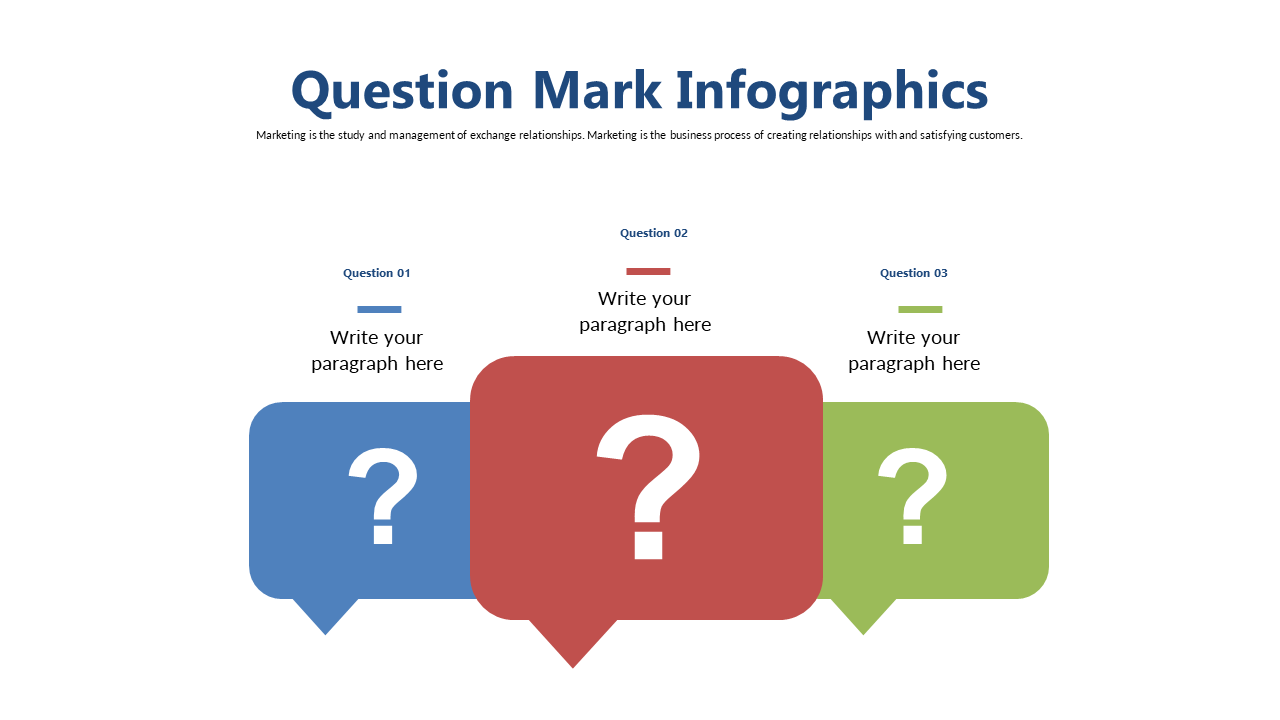
Marketing managers and content strategists tasked with presenting customer feedback during team meetings or client reviews will find this infographic slide invaluable. The editable question mark graphics allow you to tailor the message, highlighting key insights that are relevant to your audience.
For just $0.99, you can instantly download this slide and start editing it in both PowerPoint and Google Slides. It’s designed for quick customization, so you can have your presentation ready in no time.
$0.99 – Purchase Checkout
Added to cart







