Present Quarterly Milestones with Monthly Highlights

Product Description
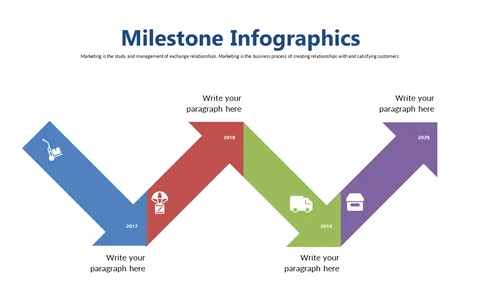
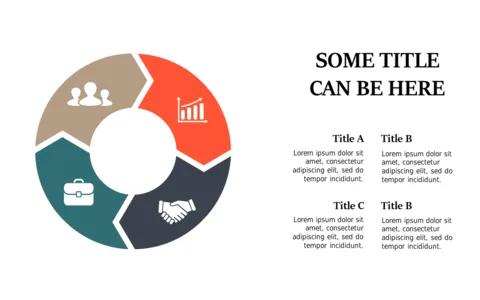
Communicating quarterly milestones can often lead to confusion, especially when digging through monthly details. It’s vital to present accomplishments clearly so everyone understands progress.
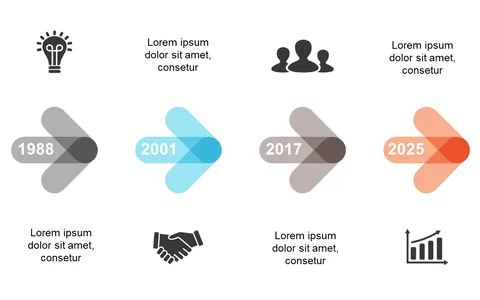
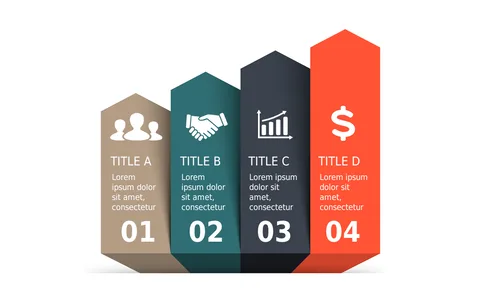
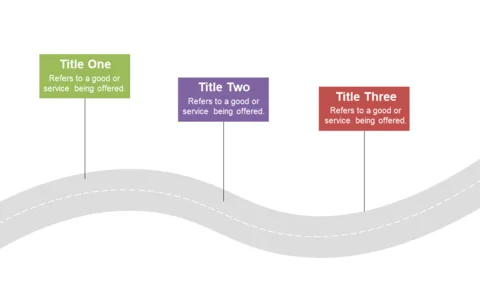
This slide offers an organized way to highlight monthly achievements, making it simple for your audience to grasp the overall timeline. Business analysts or project coordinators regularly tasked with reporting on quarterly performance will find this slide particularly useful. Whether you’re in a team meeting or presenting to upper management, this layout helps make your case clear and persuasive, showcasing the progress made over the last quarter.
For just $0.99, you can instantly access this slide and customize it to your liking in PowerPoint or Google Slides. It’s quick to edit, allowing you to create a polished presentation in minutes.
$0.99 – Purchase Checkout
Added to cart