Visualize Themes with Quadrant Infographic V2
Product Description
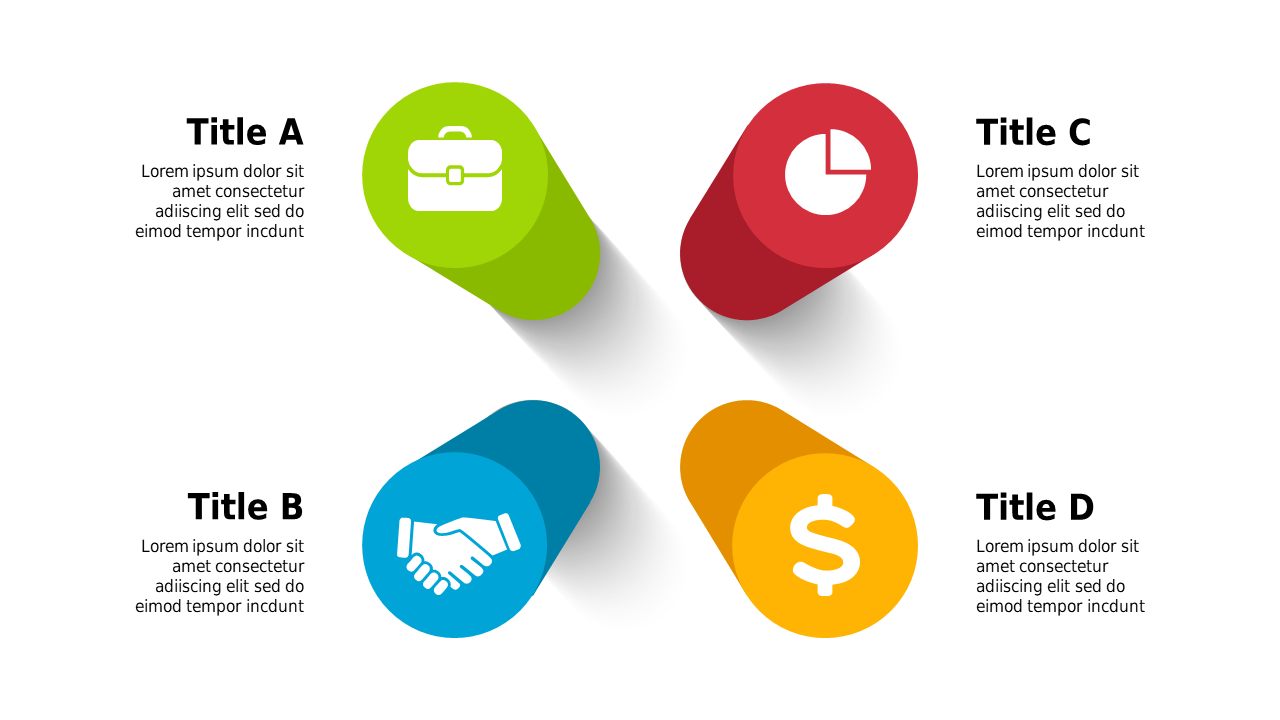
Presenting intricate themes can sometimes feel overwhelming, particularly when your audience needs clarity and conciseness. This quadrant infographic simplifies the complexity, allowing you to visually differentiate four distinct themes, making your message more engaging and straightforward.
Content strategists, brand managers, and data analysts will find this slide particularly useful when discussing business trends, financial forecasts, or partnership opportunities. It’s perfect for team meetings, client presentations, or strategic planning sessions where clear communication is essential.
Available for just $0.99, this slide is ready to download immediately and easily editable to suit your specific requirements. Whether you’re using PowerPoint or Google Slides,
you can customize it in just a few clicks.
$0.99 – Purchase Checkout
Added to cart







