Enhance Collaboration with Quadrant Infographic
Product Description
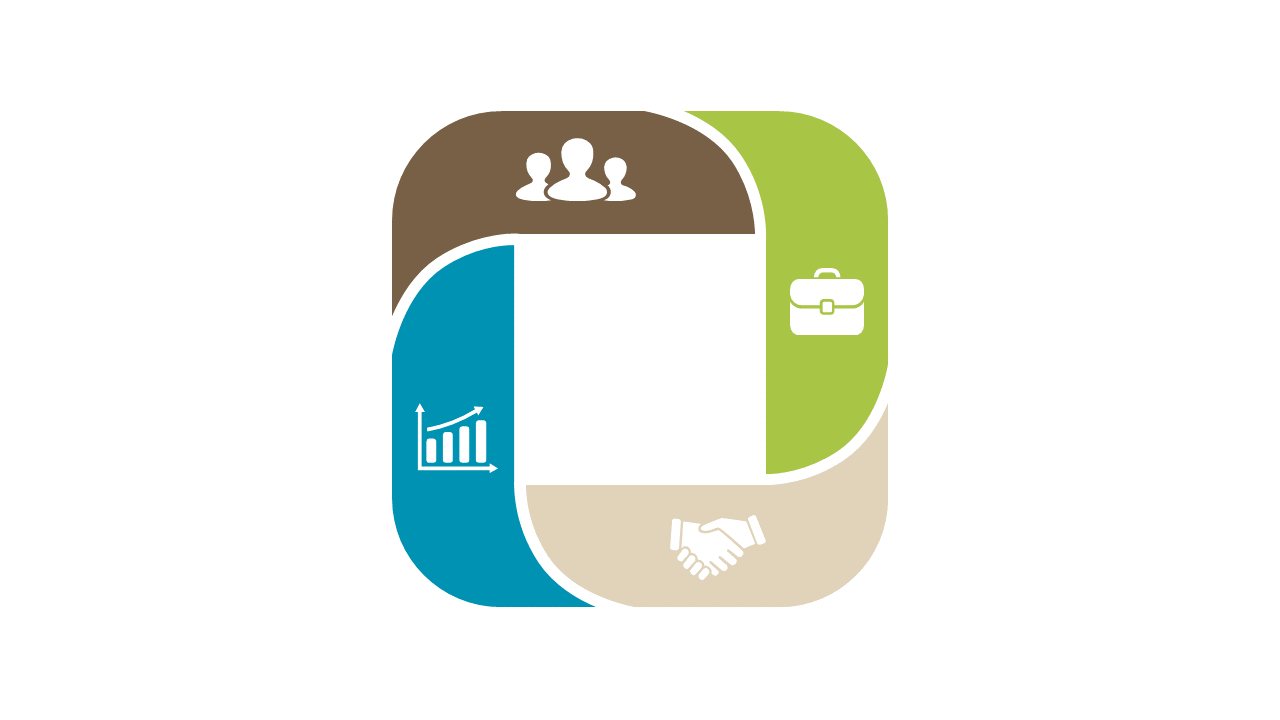
Collaboration can often be nebulous when trying to convey how teams interact and perform. This quadrant infographic makes it easier for you to present those complex relationships, using clear icons and a logical format to break down the information.
Your audience will grasp the nuances of teamwork without getting lost in jargon. Content strategists, project managers, and team leads in industries like marketing or product development will find this slide invaluable during presentations about project progress or performance reviews. Whether you’re discussing cross-departmental collaboration or analyzing team dynamics, this infographic will help articulate your points with clarity.
For just $0.99, you can instantly download this slide, edit it to fit your needs, and incorporate it into PowerPoint or Google Slides. It’s designed to be straightforward, so you can have a professional-looking presentation ready in no time.
$0.99 – Purchase Checkout
Added to cart







