Present Ideas with Puzzle Piece Infographic

Product Description
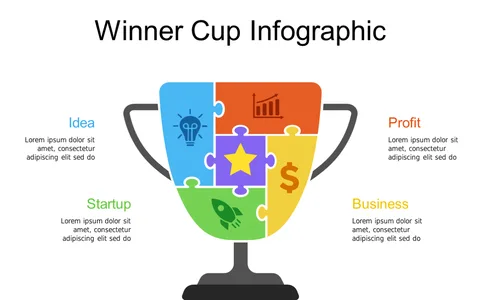
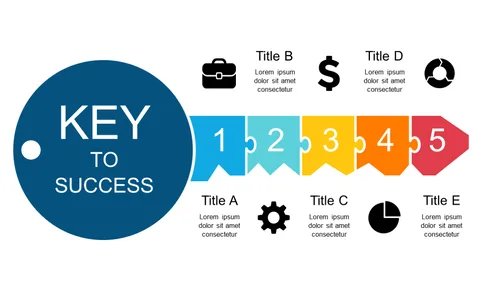
Communicating complex relationships can be a daunting task, especially when your audience needs to grasp intricate details at a glance. This puzzle piece infographic simplifies that challenge, illustrating how various concepts interconnect in a visually engaging way.
Your audience will find it easier to absorb information presented in this intuitive format. Ideal for researchers presenting findings, project managers sharing updates, or sales teams outlining service offerings, this infographic serves diverse needs across various fields. It’s especially effective during strategy sessions or client pitches, where clarity and engagement are paramount for success.
For only $0.99, you can download this infographic slide immediately and customize it in either PowerPoint or Google Slides. Spend a few minutes adding your content, and you’ll create a powerful visual that enhances understanding and keeps your audience captivated.
$0.99 – Purchase Checkout
Added to cart