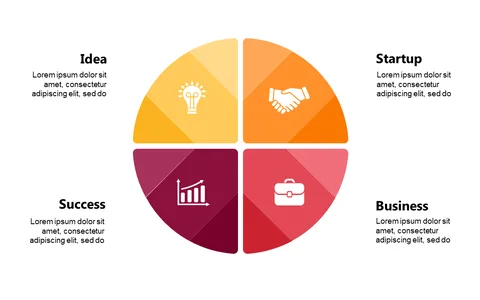
Professional Charts and Graphs PowerPoint Templates
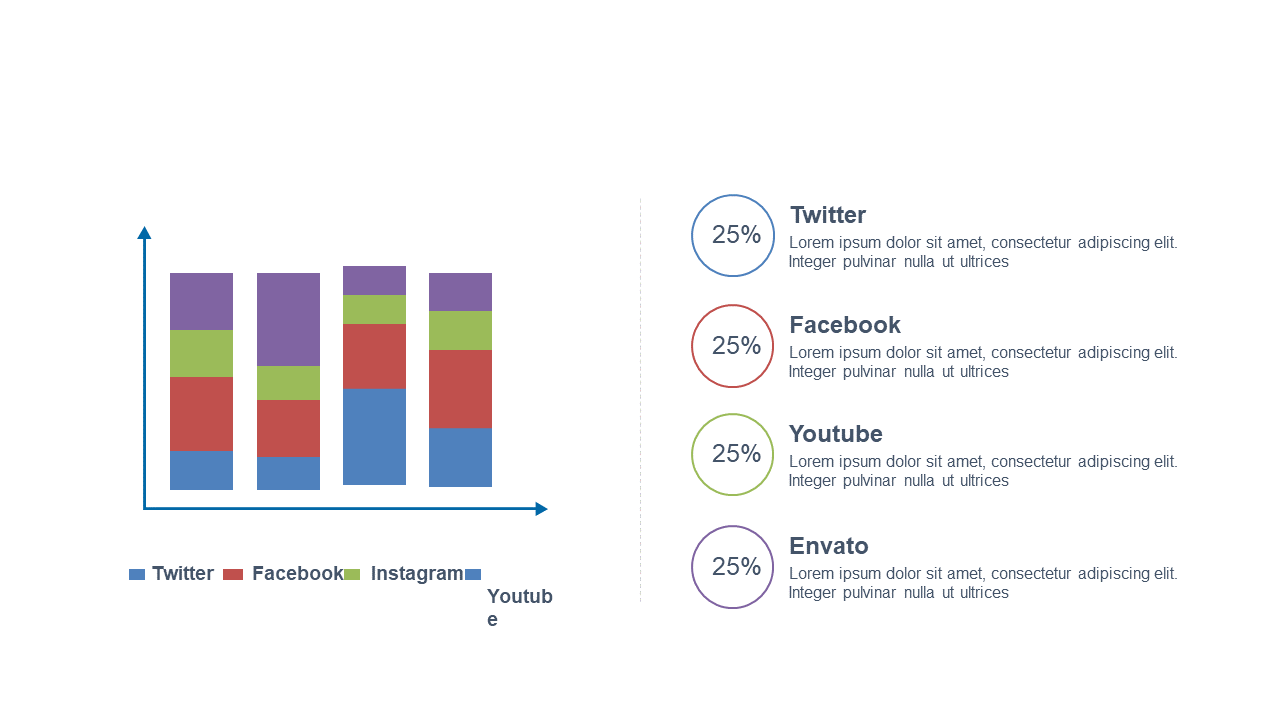
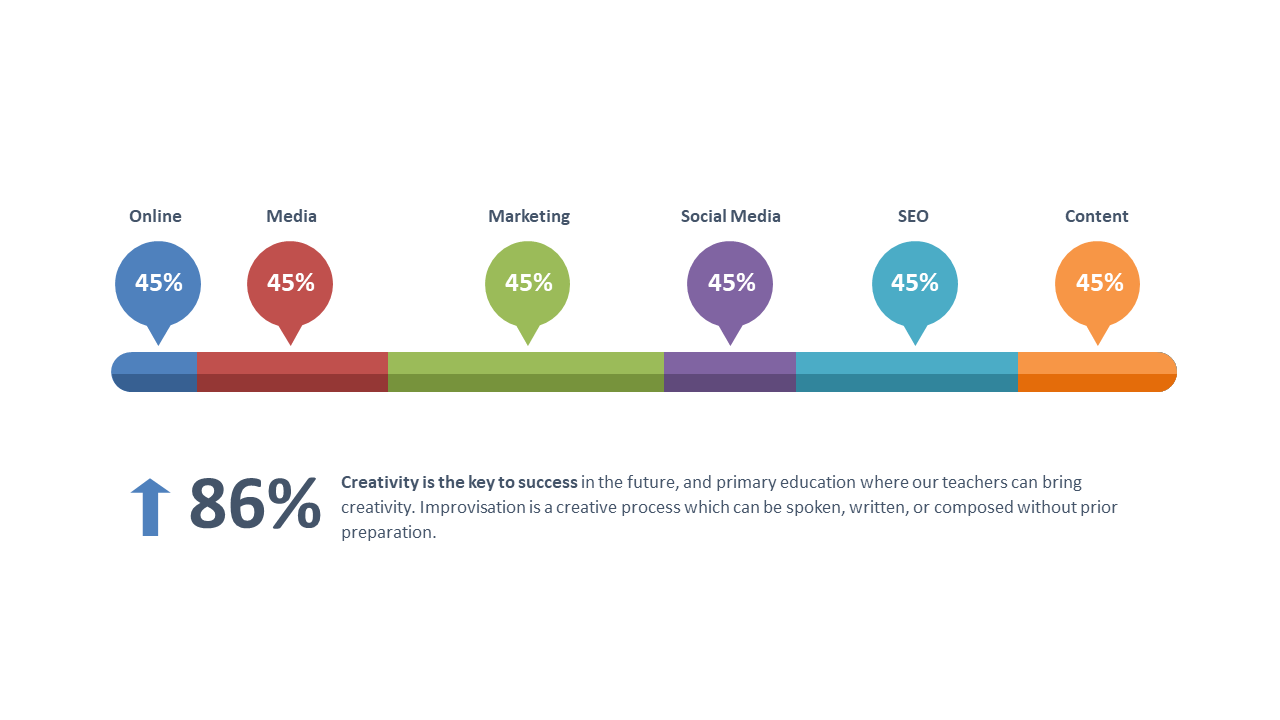

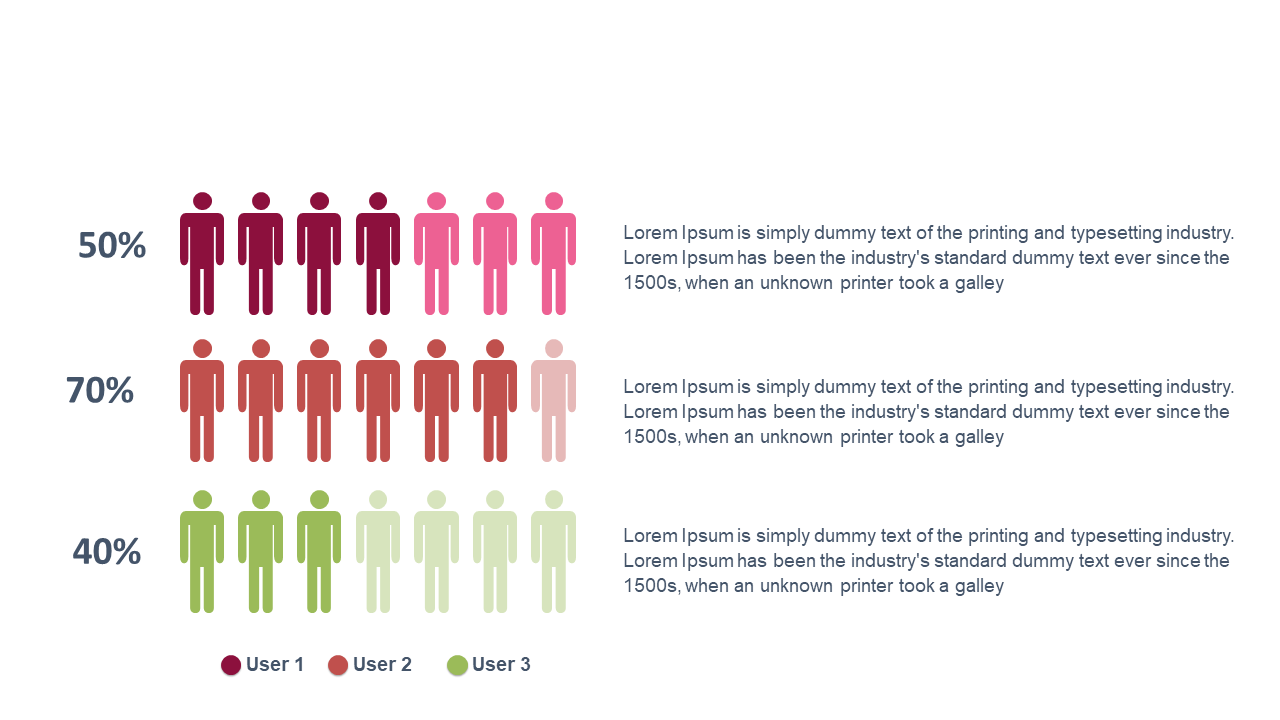
Product Description
Trying to present data in a way that’s engaging and clear can be a real challenge. You want your audience to grasp your insights quickly, but complicated visuals can lead to confusion and disengagement. A well-designed chart or graph can make all the difference in conveying your message effectively.
Perfect for business analysts, project managers, or marketing executives, this template serves a range of scenarios from quarterly performance reviews to marketing strategy presentations. Whether you’re presenting complex sales data, project timelines, or research findings, these slides provide the polished visual support you need to keep your audience focused and informed. It’s a solid choice for anyone in finance, operations, or consulting looking to enhance their reports.
The download includes 20 meticulously crafted slides, ready to help you visualize your data in a professional and clean manner. Editing is a breeze, so you can customize charts and graphs to suit your specific data and branding in just minutes. At only $3.99, this template is an affordable way to elevate your presentations and ensure your insights stand out.
🛡 7-Day Money-Back Guarantee