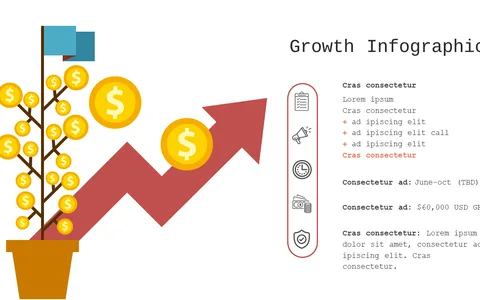
Visualize Financial Overviews with Piggy Bank Icons

Product Description
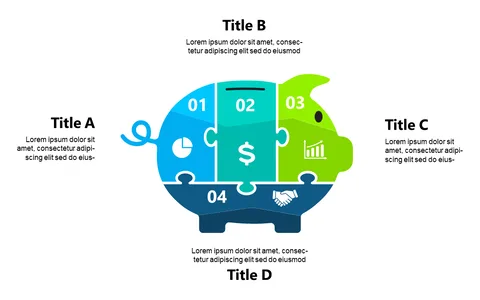
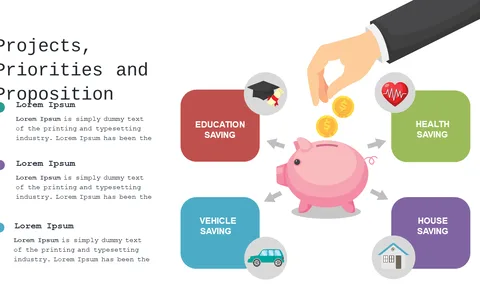
Presenting financial overviews often comes with the challenge of keeping your audience engaged while discussing complex data. This slide features a captivating piggy bank icon designed to make your financial discussions more relatable and visually appealing, easing the burden of explaining numbers and strategies.
This slide is perfect for financial managers, accountants, or team leaders conducting presentations on budget reports and forecasts. It can enhance any team meeting or company-wide presentation where you wish to convey financial information in a compelling way.
For just $0.99, you can instantly download this slide and modify it to fit your needs. It’s fully editable in PowerPoint and Google Slides, so you can make the content your own in a matter of minutes.
$0.99 – Purchase Checkout
Added to cart