Visualize Metrics with Pencil Graphic Indicators
Product Description
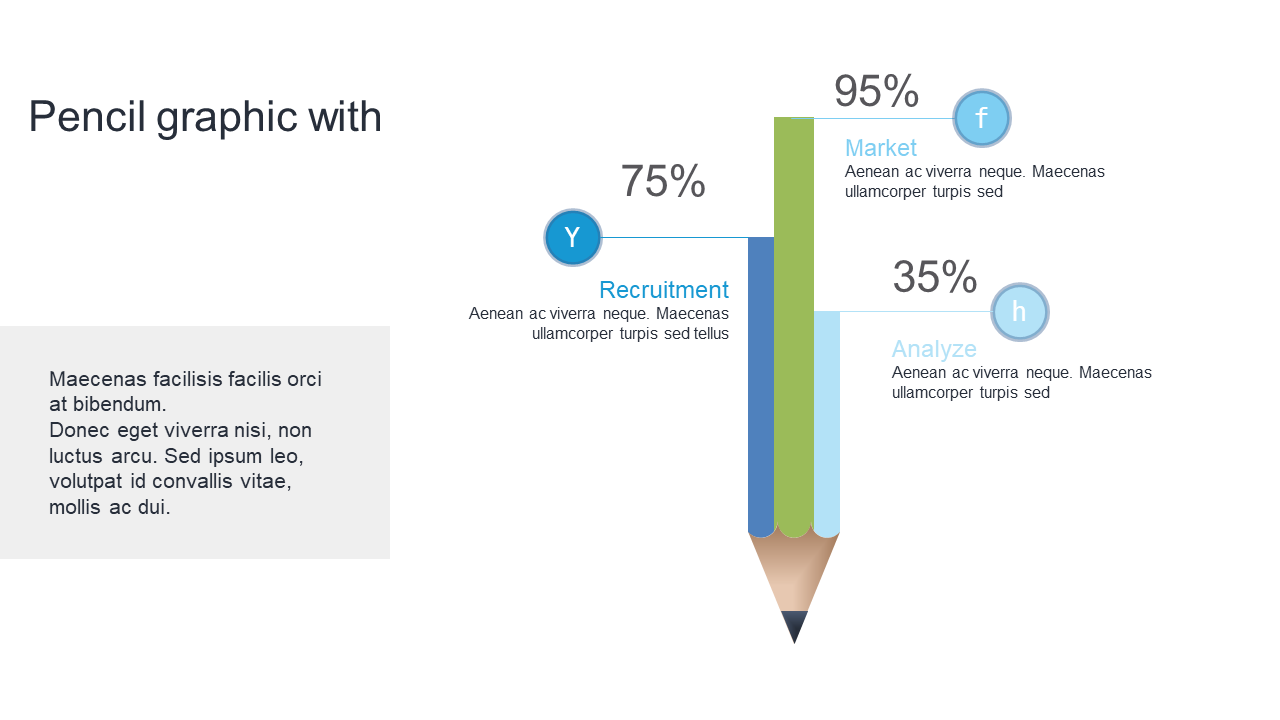
Navigating through complex data can be overwhelming, especially when you need to present vital metrics compellingly. This slide transforms those numbers into an engaging visual story using pencil graphics, effectively illustrating your key metrics while keeping your audience focused.
You’ll find that these graphics make it easier for viewers to grasp the essential information at a glance. This slide is perfect for data analysts presenting quarterly reports, marketing professionals showcasing campaign metrics, or sales managers summarizing performance outcomes. Whether you’re leading a team meeting or pitching to executives, being able to visually break down your metrics can enhance understanding and retention in any professional setting.
For just $0.99, you can instantly download this slide, which is fully editable in PowerPoint and Google Slides. Make your data presentations shine with just a few clicks, and capture your audience’s attention right away!
$0.99 – Purchase Checkout
Added to cart







