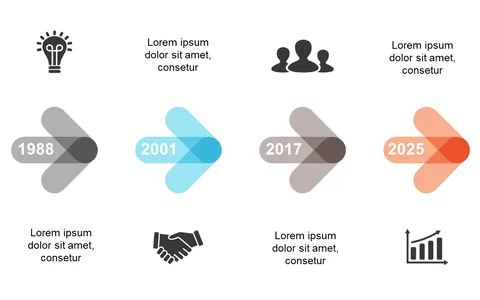
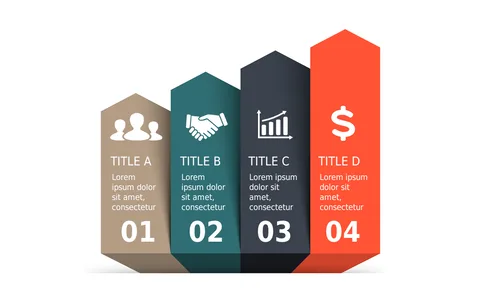
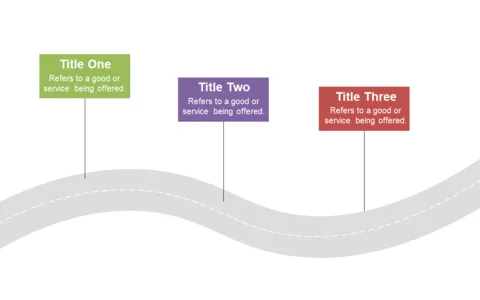
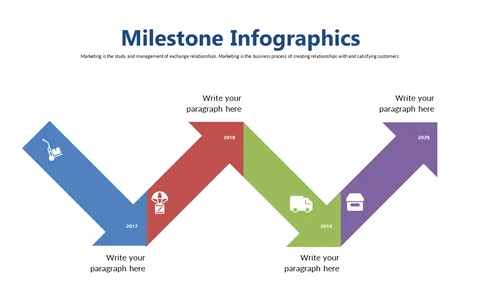
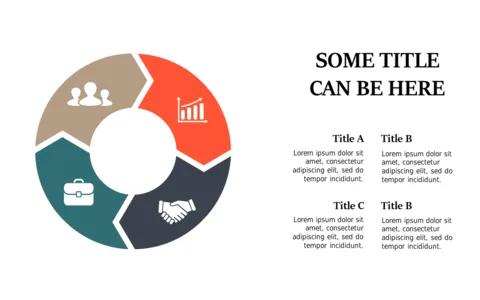
Journey Overview with Icons for Project Tracking
Product Description
Keeping track of project milestones can feel overwhelming, especially when you’re juggling multiple timelines and deliverables. You need a way to present this information clearly so everyone stays aligned and informed.
This journey overview slide uses visually appealing icons to break down complex project stages, ensuring that your audience can easily follow along. Project managers and team leads in sectors like technology, construction, or marketing will find this slide invaluable for weekly status updates or milestone meetings. Whether you’re reporting to your team or presenting to clients, this visual framework helps clarify your progress and keeps everyone on the same page.
This slide is available for just $0.99, making it a budget-friendly addition to your presentation toolkit. It’s ready for instant download and can be easily edited in both PowerPoint and Google Slides, allowing you to customize it to fit your unique project needs.
$0.99 – Purchase Checkout
Added to cart