Illustrate Medical Data Relationships with Infographic
Product Description
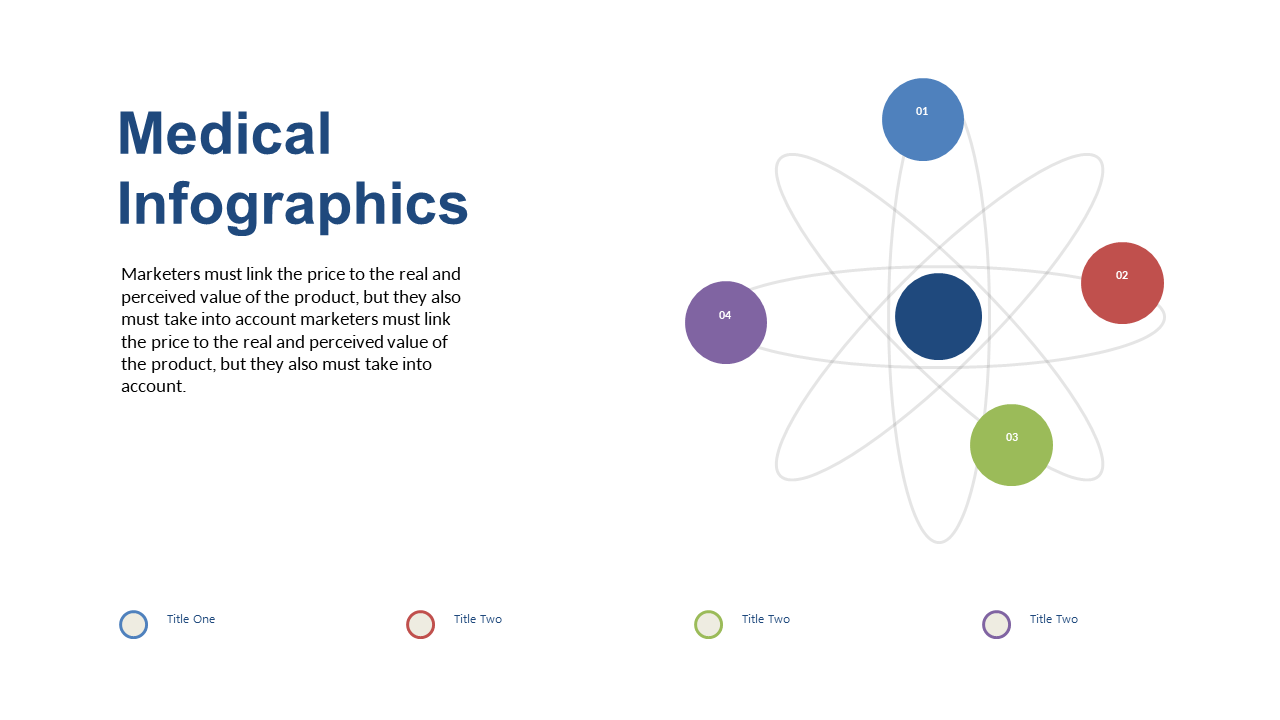
Navigating the intricacies of medical data can be daunting, especially when you need to illustrate relationships clearly. This infographic slide presents a central node connected to vibrant circles, making complex information more approachable and visually engaging for your audience.
Data analysts, healthcare professionals, and project managers in clinical research will find this slide incredibly helpful. Whether you’re presenting a complex study to your peers or illustrating key insights during a team meeting, this design helps clarify data relationships effectively.
For just $0.99, this slide is ready for an instant download, allowing for quick customization. You can easily edit it in PowerPoint or Google Slides, making your preparation process faster and more efficient.
$0.99 – Purchase Checkout
Added to cart







