Illustrate Engagement Metrics with Marketing Funnels

Product Description
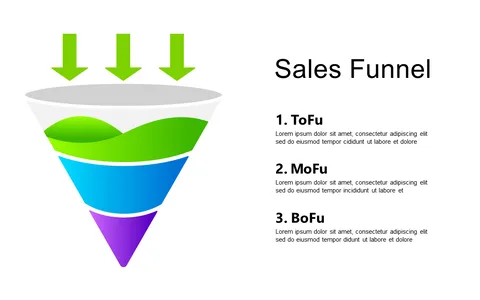
Getting your audience to grasp the key metrics of your marketing funnels can be a challenge, especially when the numbers are critical to your strategy. A standard presentation of data can bore viewers rather than engage them. This slide visually divides the marketing funnel into recognizable sections, clearly illustrating the stages of the customer journey and making complex metrics more digestible.
Marketing analysts, campaign managers, and digital strategists will find this slide invaluable during performance reviews or strategy planning sessions. Use it to highlight conversion rates at each stage—Top of Funnel, Middle of Funnel, and Bottom of Funnel—so stakeholders can quickly see where to focus efforts.
This clear representation will help your team make informed decisions on how to enhance customer engagement and optimize conversion strategies. For only $0.99, you can download this slide instantly and edit it effortlessly in PowerPoint or Google Slides. With customizable sections and easy-to-update statistics, you’ll be able to tailor the content to reflect your specific metrics and goals in just minutes.
$0.99 – Purchase Checkout
Added to cart