Map Infographic with Key Data Highlights
Product Description
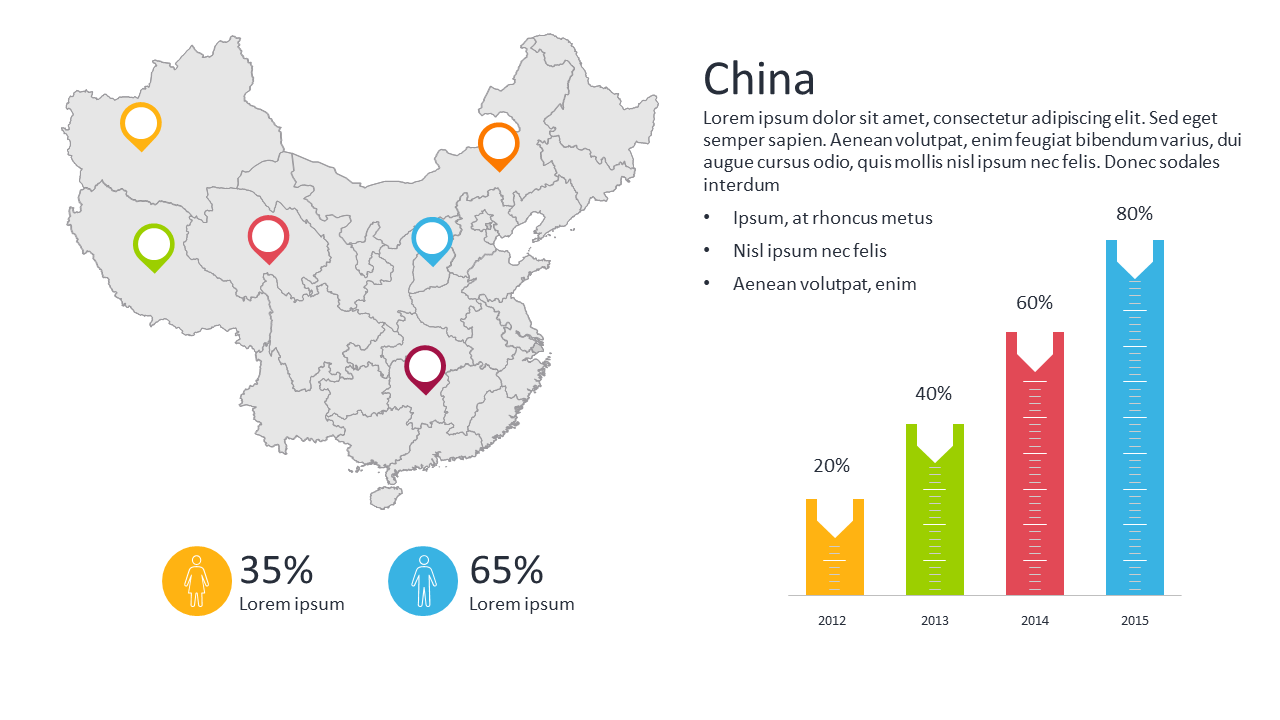
Communicating critical insights quickly can be tricky, especially when data is dense and complex. This map infographic slide cuts through the clutter with a visually engaging design that highlights key statistics and trends.
It captures attention while providing a clear overview of vital information. Business strategists and educators can benefit from this slide during market analysis presentations or academic lectures. If you’re conveying trends in specific regions or discussing economic data, the color-coded markers and bar chart will make your points clear and compelling, resonating well with your audience.
At just $0.99, you can download this infographic slide and start using it right away. It’s fully editable in PowerPoint and Google Slides, allowing you to customize it in minutes to fit your presentation perfectly.
$0.99 – Purchase Checkout
Added to cart







