Visualize Geographic Data with Location Pins
Product Description
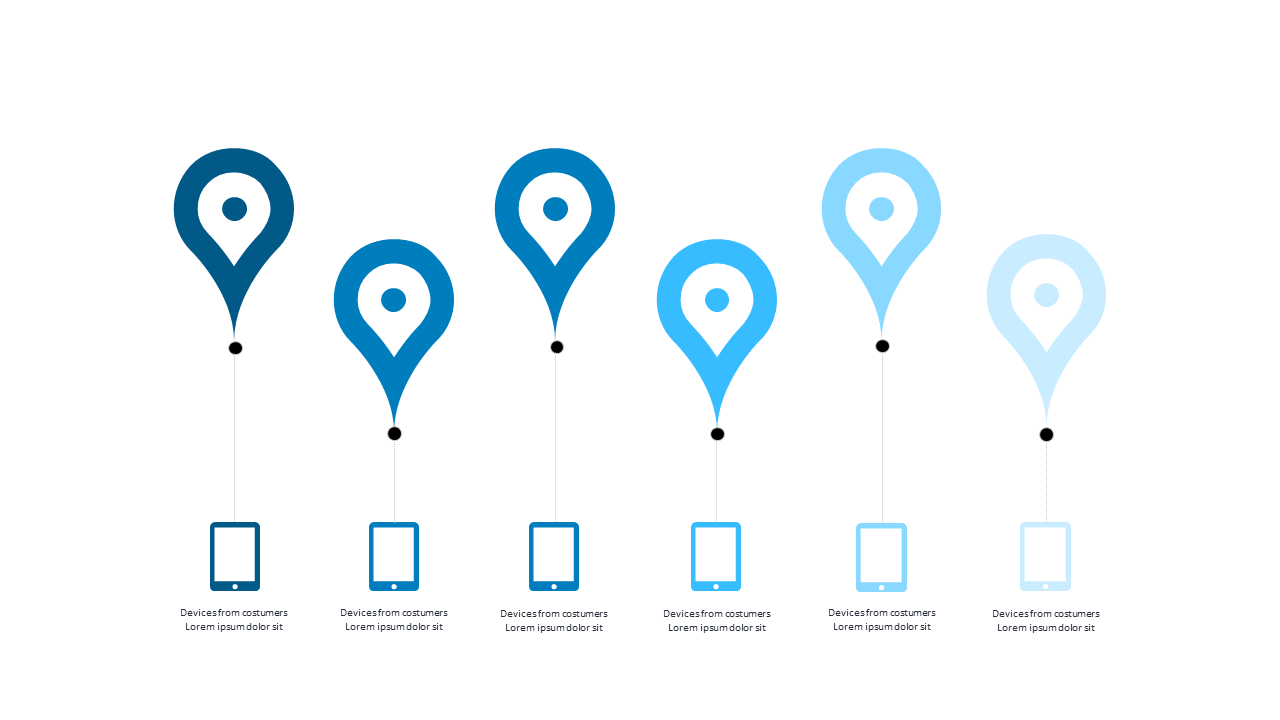
Struggling to present geographic data in a way that resonates? This slide effectively utilizes eye-catching location pins linked to critical data points, helping your audience grasp insights quickly and easily.
Perfect for data analysts and regional managers during quarterly reviews, market research presentations, or strategy sessions, this slide allows you to present geographic insights compellingly. It helps clarify complex data, whether you’re discussing sales territories or audience demographics.
You can get this slide for just $0.99, and it’s quick to download and edit in PowerPoint and Google Slides. You’ll be ready to impress your audience with clear visuals in just a few minutes.
$0.99 – Purchase Checkout
Added to cart
✅ Instant delivery
✅ Fully editable
✅ PowerPoint & Google Slides
Category:
$0.99
Per slide · No minimum · Pay only for what you pick
✓ $0.99/slide
No minimum order
✓ Mix any category
No subscription
Building a full deck?
Mix slides from any of our 58 categories —
all merged into one PowerPoint.
$0.99/slide, no minimum.
Browse All Slides →







