Illustrate Interconnected Concepts with Circles
Product Description
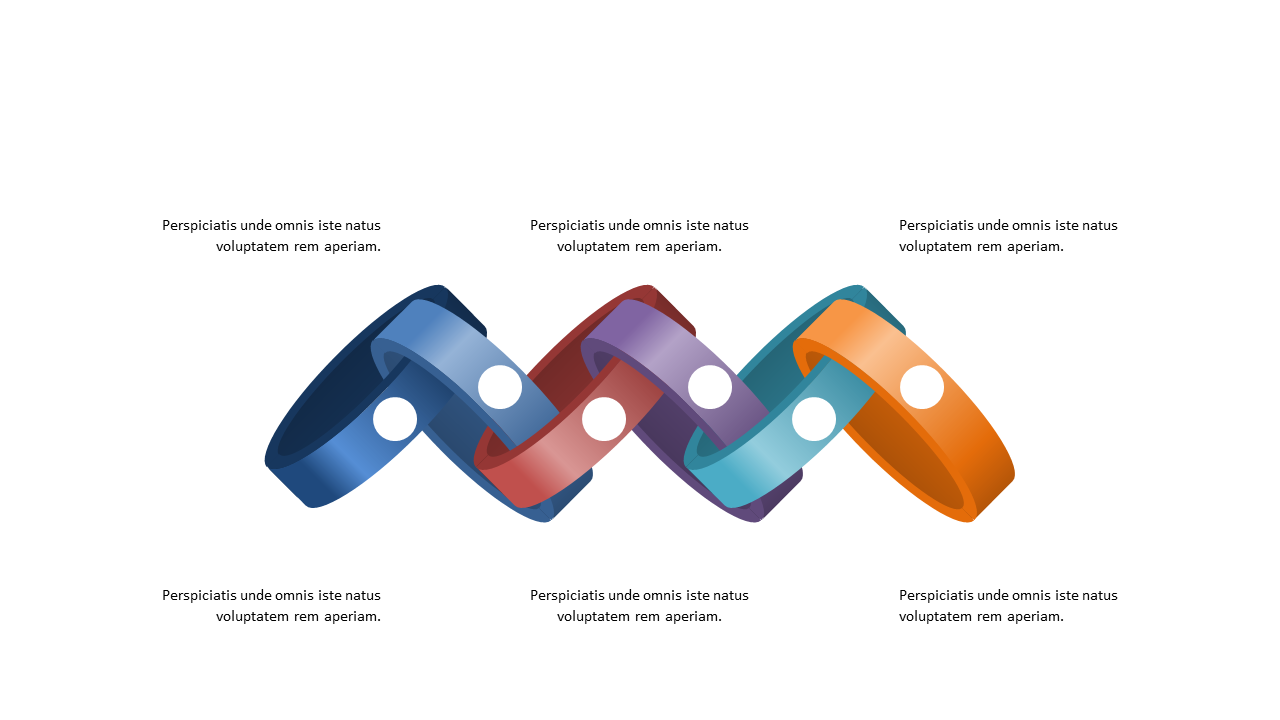
Complex ideas can be difficult to convey, especially when you’re trying to show how different concepts interlink. If you’re struggling to illustrate these relationships clearly, this slide makes it easy with a series of interlinked circles designed for descriptive text.
You’ll find that your audience can grasp intricate connections in no time. This slide is particularly beneficial for educators explaining interconnected theories, consultants presenting comprehensive frameworks, or creative directors discussing how various ideas contribute to a project. Each circle provides an intuitive way to showcase how concepts relate to one another, making it a solid choice for workshops or brainstorming sessions.
For only $0.99, this slide can be downloaded instantly and is fully editable in both PowerPoint and Google Slides. You’ll have a polished visual ready to go in minutes.
$0.99 – Purchase Checkout
Added to cart







