Showcase Interconnected Concepts with Circles
Product Description
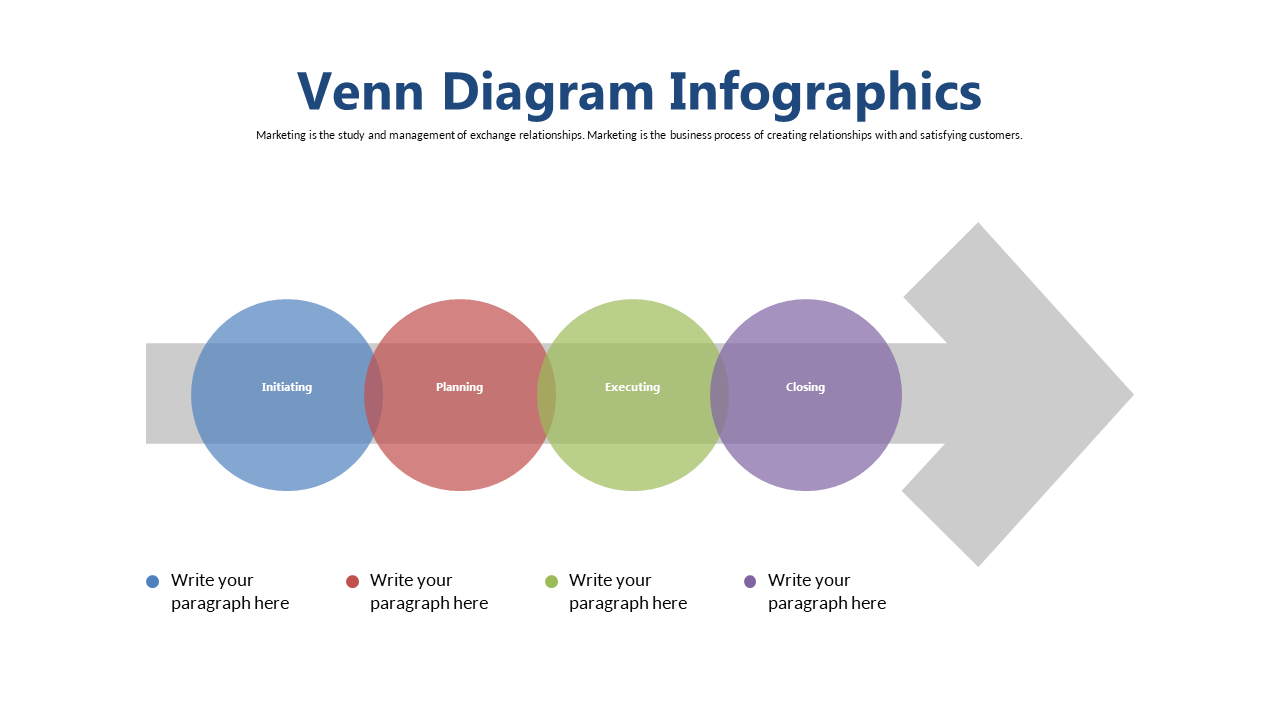
Communicating complex concepts can be a real hurdle, especially when trying to explain how various elements interconnect. If you find that your audience struggles to see the big picture, this slide showcases interconnected circles that visually represent relationships.
It’s a great way to make your message clear and engaging. Use this slide if you’re a business consultant illustrating a strategic plan, an academic sharing research findings, or a marketing professional explaining the components of a campaign. It’s particularly effective in collaborative environments where visual aids can enhance collective understanding and foster dialogue.
For only $0.99, this slide is available for instant download and can be easily edited in PowerPoint and Google Slides. You’ll have a polished and clear visual ready for your next presentation in just minutes.
$0.99 – Purchase Checkout
Added to cart







