Show Environmental Impact with Lightbulb Infographic
Product Description
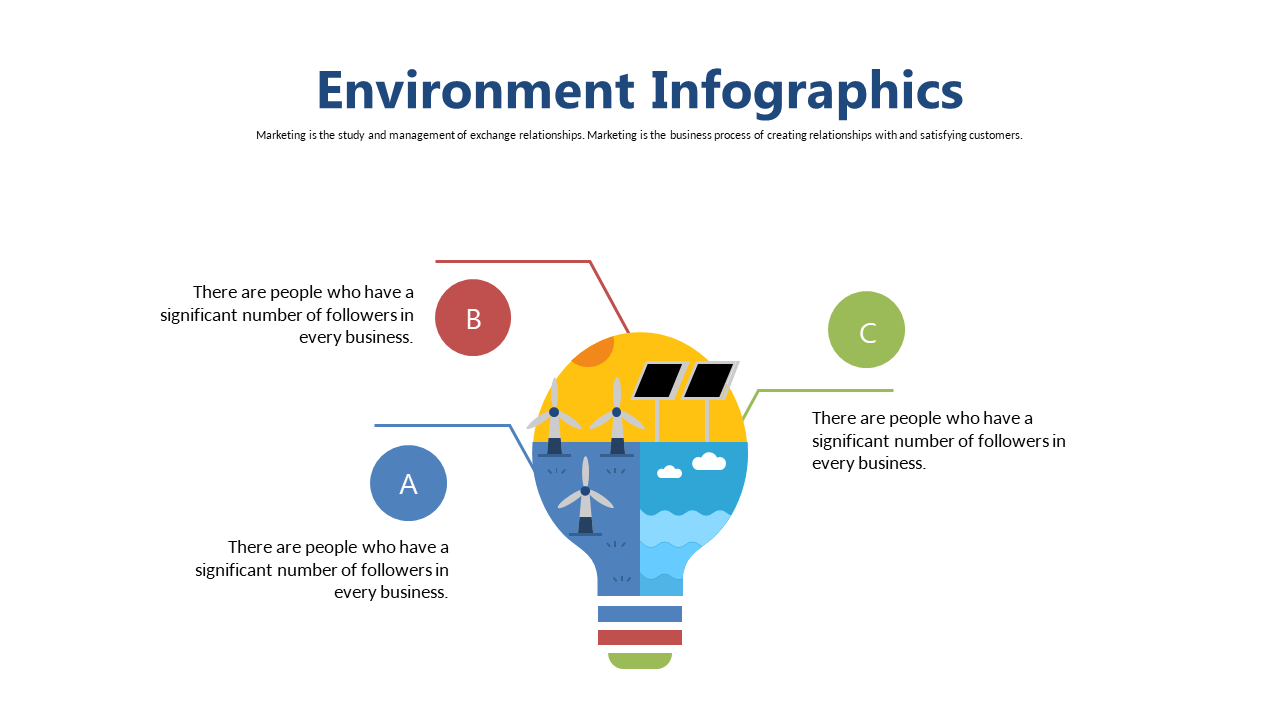
Finding a way to present environmental data that captivates your audience is no small feat. This lightbulb infographic transforms complex sustainability metrics into an engaging visual format, allowing you to convey the importance of environmental responsibility without overwhelming your viewers.
Environmental consultants and sustainability officers can leverage this slide during annual reports, community outreach presentations, or educational seminars. Whether you’re showcasing renewable energy initiatives or discussing carbon footprints, this infographic makes your data more relatable and easier to understand.
You can get this slide for just $0.99, and once downloaded, it’s ready for editing in PowerPoint or Google Slides. The design is simple to adapt, so you can present your information in a way that resonates with your audience.
$0.99 – Purchase Checkout
Added to cart







