Present Data with Hamburger Compartment Layout
Product Description
Presenting data can feel like an uphill battle, especially when you want to keep your audience engaged. Traditional layouts often fail to capture attention and make complex information seem overwhelming.
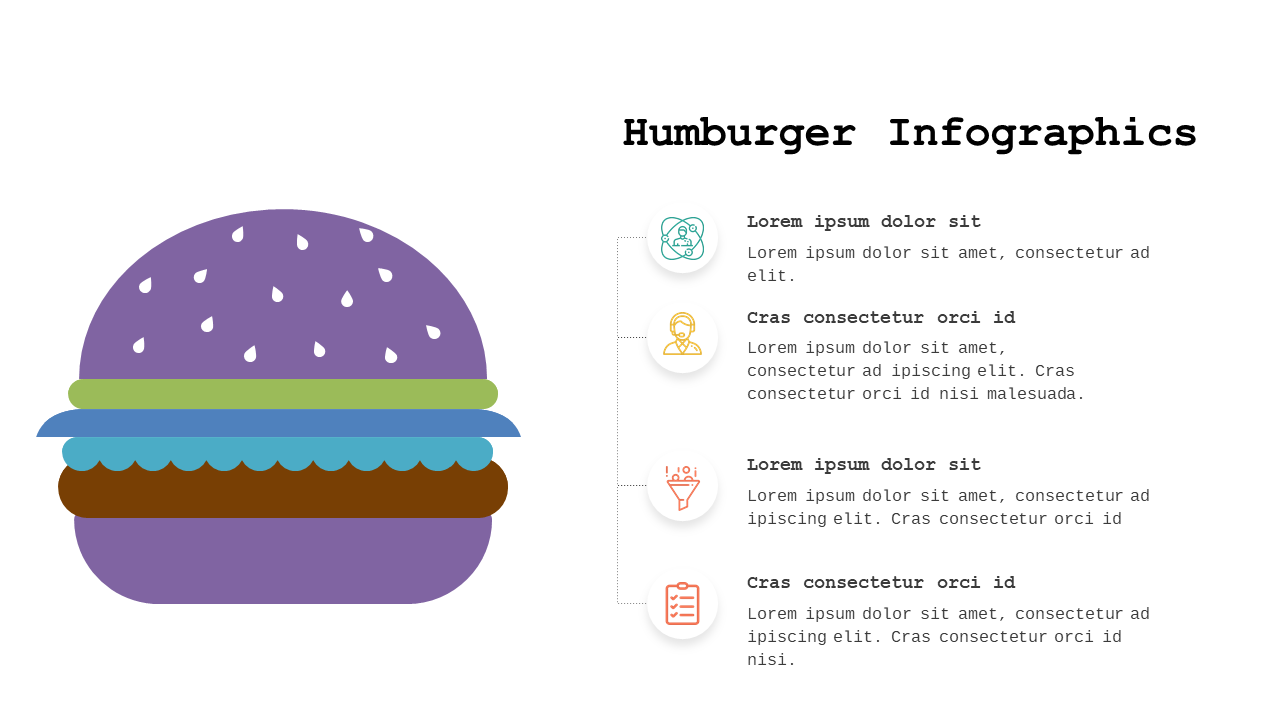
This hamburger compartment layout slides in to save the day, offering a fresh perspective on data presentation that’s both engaging and clear. This slide is perfect for marketing analysts delivering quarterly reports, sales managers showcasing performance metrics, or educators presenting research findings. Whether you’re leading a team meeting or pitching to clients, this layout enables you to highlight your key points effectively while keeping your audience focused.
For just $0.99, you can download this slide and have it ready in minutes. It’s fully editable in both PowerPoint and Google Slides, allowing you to customize it to fit your own data and style with ease.
$0.99 – Purchase Checkout
Added to cart







