Engage Audience with Cost Representation Slide

Product Description
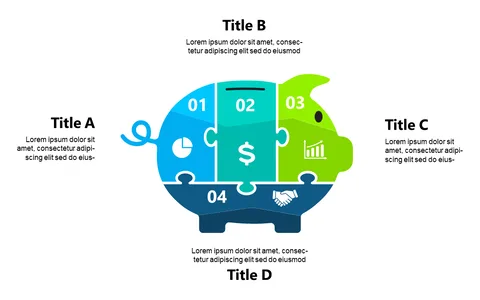
Finance presentations often lead to disengaged audiences, especially when numbers are flying around without context. This slide is designed to re-engage your listeners by using an eye-catching illustration of a character holding a dollar sign, bringing a human element to financial discussions.
It makes budget details more appealing and easier to understand. Ideal for financial analysts presenting annual budgets or CFOs delivering financial forecasts, this slide can help bring your numbers to life. It’s perfect for board meetings, budget reviews, or any situation where you need to keep your audience interested while discussing figures.
Priced at just $0.99, this slide is quick to download and simple to edit in PowerPoint or Google Slides. Customize it to match your presentation style, and you’ll have an engaging visual ready to go within minutes.
$0.99 – Purchase Checkout
Added to cart