Showcase Key Insights with Iceberg Diagram
Product Description
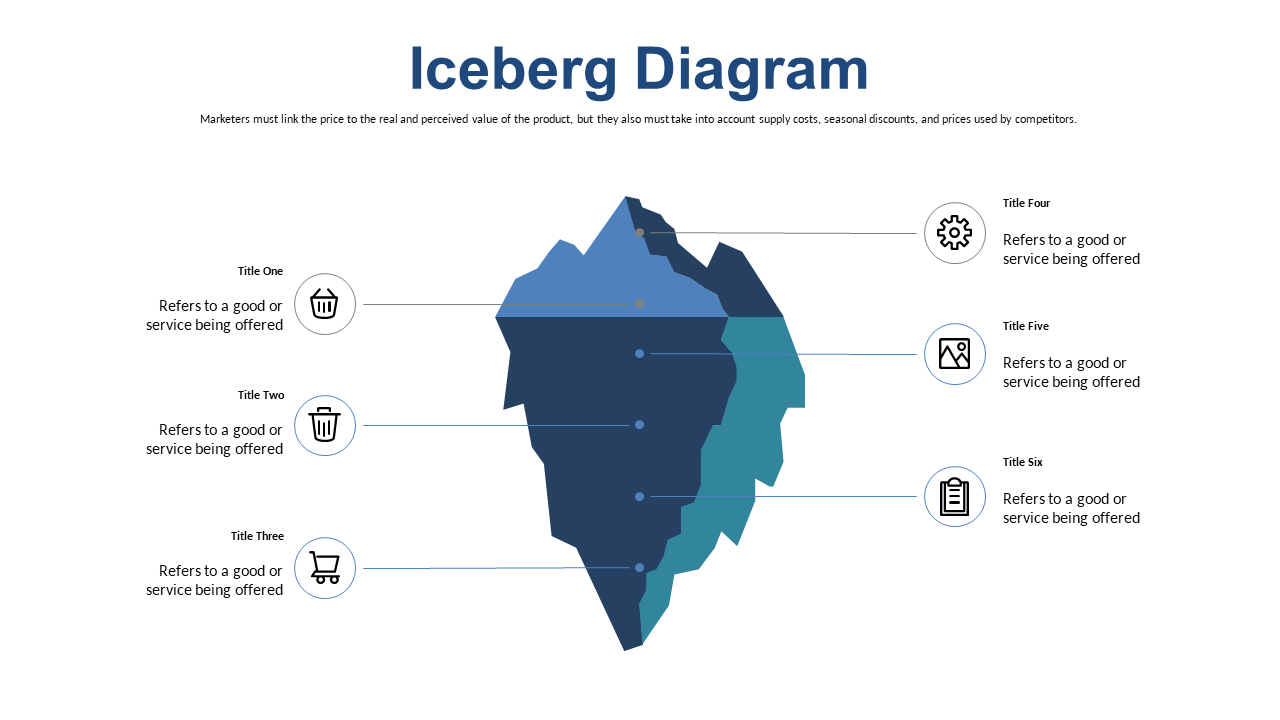
Communicating complex data is no small feat, especially when trying to convey deeper insights beyond just surface-level statistics. This Iceberg Diagram allows you to visually break down the relationship between easily digestible information and the underlying factors that inform decision-making.
It helps to bridge the gap between understanding and action. Communications specialists and public relations managers can use this slide in presentations to stakeholders or team meetings, where clarity is essential for strategic planning. Whether you’re dissecting campaign performance or presenting research findings, this diagram will help your audience grasp the essential nuances that drive your communication strategies.
Available for just $0.99, this Iceberg Diagram is ready for you to download and customize. It’s easy to edit in PowerPoint or Google Slides, so you can quickly adapt it to fit your specific narrative and engage your audience effectively.
$0.99 – Purchase Checkout
Added to cart







