Visualize Efforts and Results with Hourglass Infographic
Product Description
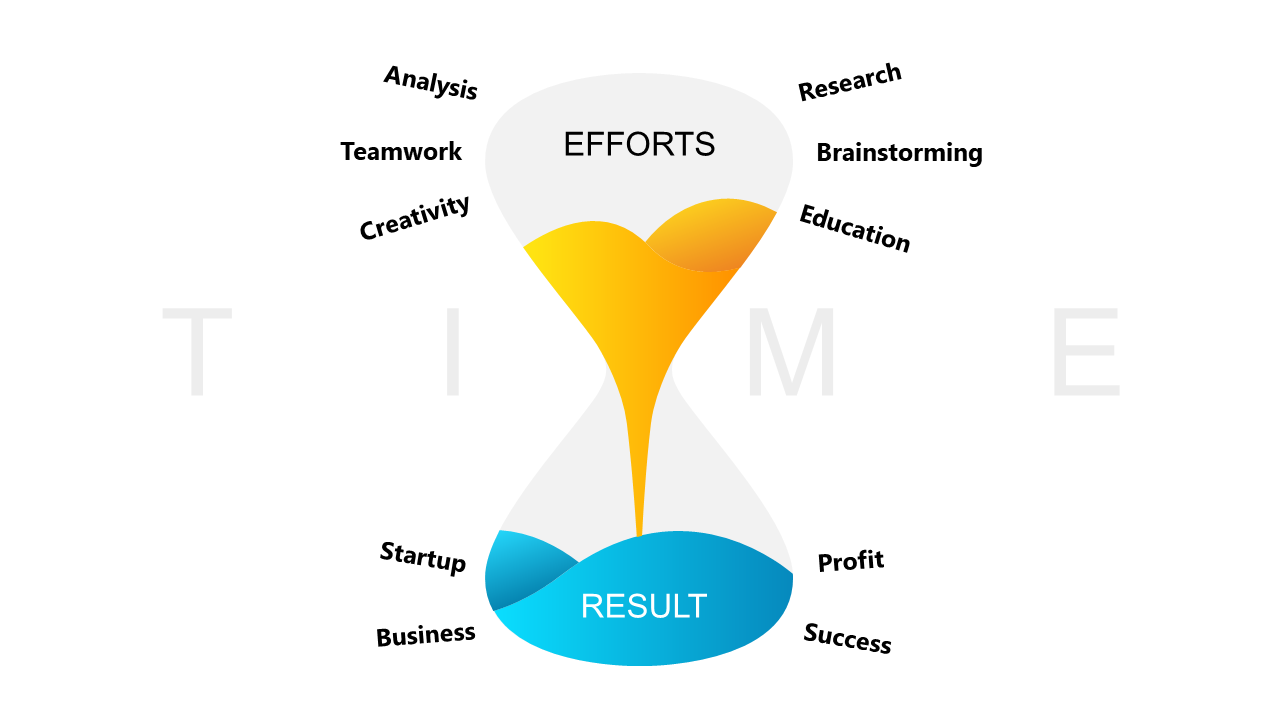
Illustrating the connection between efforts and outcomes can be difficult, but this hourglass infographic makes it straightforward. It visually communicates how various elements contribute to success, helping your audience see the bigger picture without being overwhelmed by details.
This slide distills complex relationships into an easy-to-understand format. You can utilize this infographic as a business executive detailing the impact of team collaboration on project results, or as a marketing manager depicting the correlation between advertising efforts and sales growth. It’s particularly useful in presentations, reports, or performance reviews where demonstrating effectiveness is crucial.
For only $0.99, you can download this slide instantly, and it’s fully editable in PowerPoint and Google Slides. Get ready to tailor it quickly to your specific needs, ensuring you’re prepared to impress your audience in no time.
$0.99 – Purchase Checkout
Added to cart







