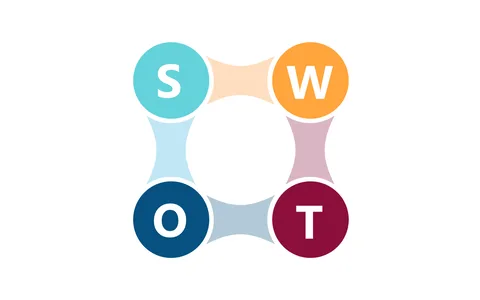
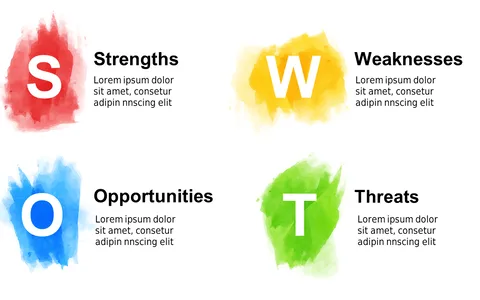
Visualize SWOT Analysis with Hexagonal Infographic

Product Description
When tasked with presenting a SWOT analysis, clarity is crucial, but complexity often sneaks in. You want to make sure your audience can quickly grasp the key elements without confusion.
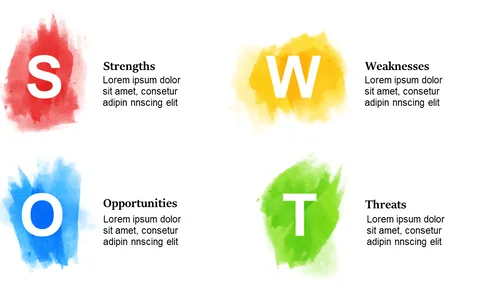
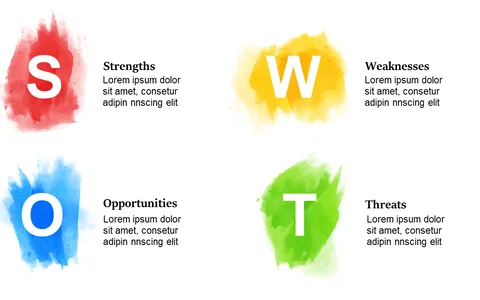
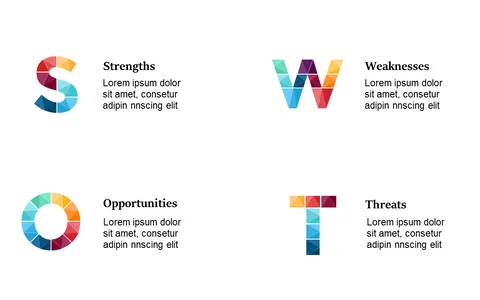
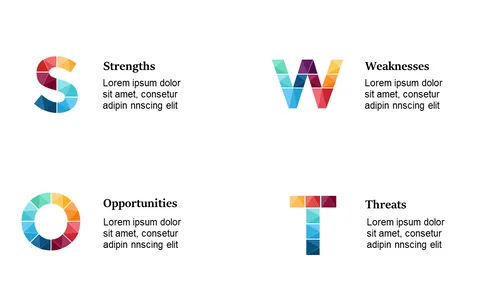
This slide uses a visually striking hexagonal infographic to clearly represent Strengths, Weaknesses, Opportunities, and Threats, ensuring your message is absorbed effortlessly. This format works wonderfully for financial analysts, business consultants, and executives during performance reviews or strategy workshops. If you are in a startup focused on growth strategies or a corporate manager preparing for a strategic pivot, this slide will help you lay out your analysis clearly and effectively.
For only $0.99, this slide can be downloaded instantly and is fully editable in both PowerPoint and Google Slides. You’ll be able to jump right in and customize it to suit your presentation needs without a hassle.
$0.99 – Purchase Checkout
Added to cart